
Search Results: Subject equal to 'Data visualization' - David Rumsey Historical Map Collection. This Animated Data Visualization Of World War II Fatalities Is Shocking. Timeline: Ukraine's pro-Russian unrest - Interactive. Paris en 32 chiffres. Britain's 100 years of conflict. Improving data visualisation for the public sector. HERE IS TODAY. Infographics. The Gold Series: Unearthing The World's Gold Supply This infographic, part two in our 2014 Gold Series, covers the full supply picture behind the yellow metal.
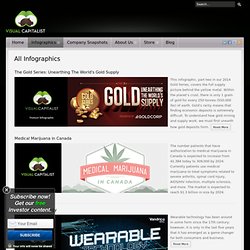
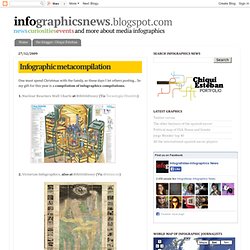
Within the planet’s crust, there is only 1 gram of gold for every 250 tonnes (550,000 lbs) of earth. Gold’s rarity means that finding economic deposits is extremely difficult. To understand how gold mining and supply work, we must first unearth how gold deposits form. The Infographics Gallery. The Infographics Showcase. Journalisme graphique. Infographic metacompilation. Infographic metacompilation One must spend Christmas with the family, so these days I let others posting...
Infographics and Data Visualization. 50 great examples of infographics. The 22 Best Infographics We Found In 2011. 2011 was a huge year for infographic design. Large companies embraced data renderings as a business strategy like never before, whether it was to promote their brand (GE) or bolster their bottom line (the New York Times). Nowhere was that more evident than at Facebook. Timeline, the site’s most ambitious redesign to date, brought the central tenet of data viz--organizing unwieldy bits and bobs into a compelling, visual narrative--to millions of people around the world.
As infographics go mainstream, infographic designers grow bolder. 50 Informative and Well-Designed Infographics. It’s impossible to comprehend complex data or analyze large amounts of information, if we only use words or texts.
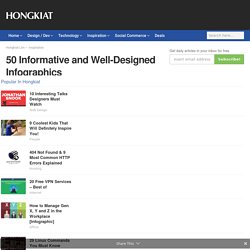
Information graphics or better known as infographics are visual explanation of data, information or knowledge. Column Five Media. S Best Videos, Infographics, Podcasts, and Slideshows of 2011 - Sarah Green - Our Editors. Creative Infographic Design & Information Graphics. The Last 10 Years...Visually. Great chart by Phillip Niemeyer over on NYTimes.com, Picturing the Past 10 Years.
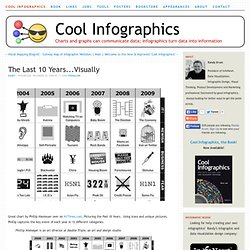
Using icons and unique pictures, Phillip captures the key event of each year in 12 different categories. Phillip Niemeyer is an art director at Double Triple, an art and design studio. Power of Data Visualization - An infographic inspiration site. Infographic Designs for Inspiration. Infographics play an important role when conveying information, they need to have eye catching designs which grab the viewers attention and show the info in a clear & simple fashion and must not be complicated.
Sometimes analyzing data using only text and words can be boring and difficult to understand. Cool Infographics - Blog. An infographic is a visual representation of information. London Transport Infographics, 1912-1969. The Cool Infographics 2011 Gallery...A Pinterest Experiment.
Check out the Cool Infographics 2011 Gallery!
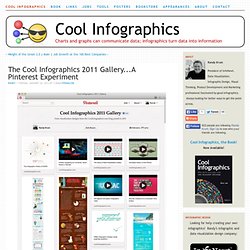
I’m trying an experiment using Pinterest to create a one-page, visual gallery of the infographics I post. On this board I have pinned every post from the Cool Infographics blog from last year, and it makes a really nice, visual way to browse through the infographics I have shared. One of the reasons I wanted to play around with Pinterest is that it displays the entire (sometimes very long) infographic, not just a square thumbnail like many galleries. In general, I keep the 10 most current posts on the front page of the blog. Once they scroll off the front page, of course their traffic and visibility drops off dramatically. Because infographics is, by definition, a visual media, I think people would be more likely to find examples they like and inspiration for their own type of design if there was a better way to browse. I am absolutely looking for feedback, so please leave your thoughts in the comments. Best of the visualisation web… January 2012 (part 2) At the end of each month I pull together a collection of links to some of the most relevant, interesting or thought-provoking web content I’ve come across during the previous month.
If you follow me on Twitter and Google+ you will see many of these items shared as soon as I find them. Here’s part two of the latest collection from January 2012 (see part one): Periscopic | Flavour of the moment, Periscopic, featured in the Feb issue of Print Magazine | Article. WeLoveDatavis. Browsing visualizations.
Chart Porn. 15 examples. Data Visualization is a method of presenting information in a graphical form.

Good data visualization should appear as if it is a work of art. This intrigues the viewer and draws them in so that they can further investigate the data and info that the graphic represents. In this post there are 15 stunning examples of Data Visualization that are true works of art. Click on the title or image for a larger view of each visualization. The Strengths of Nations Here’s an image that discusses the variations in how different nations pursue science. Madrid.Citymurmur CityMurmur tries to understand and visualize how media attention reshapes the urban space and city. 6 Excellent Visualization Websites. Designers, artists, visualization junkies listen up!
I know that sometimes it can be difficult to find inspiration, which is why I want to help you out. About a week ago, I was checking out the Visualy blog when I came across a super cool post by Visually’s Visualization Architect, Drew Skau. Matt Stiles // The Daily Viz. A Periodic Table of Visualization Methods. 20 Great Visualizations of 2011. As the popularity of visualizations grows, so does their range and quality.
Here’s a list of 20 of the best Static Visualizations, Interactive Visualizations, and Information Videos from 2011. (Note: while they are numbered for your convenience, the entries are not ranked.) Static Visualizations Often, static infographics are created without much thought, just as fodder to get clicks on the web. These eight, however, are well-considered visualizations that do a fantastic job of conveying information.1. What Are The Odds? Curiosity counts: Archive. 3 tags “One of the great myths of the school system is that we tell people that everyone...” – Dale J. Information Is Beautiful.
Healthy magination. Infographic Of The Day: Could A Tool Like This Turn Every M.D. Into Dr. House? When you visit the doctor complaining of a cough or stomach pain, they usually seem to know what to do: They'll ask if you have trouble breathing, or check your heart rate. But it's all a little baffling: What are they checking for? What illnesses could it be? This remarkable new infographic by GE, working with MIT's SENSEable City Lab, peels back how various symptoms of illness are linked, giving you a tantalizing look into the mind of a doctor. The interactive chart is powered by 7.2 million medical records, gathered between 2005 and 2010. Celebrating Excellence in Data Visualization and Information Design. Visualizing Data at the Oxford Internet Institute.
OWNI Data en forme. Les data en forme. La veille des journalistes de données d'OWNI vous transporte cette semaine d'Espagne en Papouasie-Nouvelle-Guinée, et fait une escale à Neuilly-sur-Seine. L’Espagne aura l’honneur d’ouvrir le bal de notre veille “data” cette semaine. Non parce qu’elle accueille le G20 de Cannes cette année, mais parce que nous y avons trouvé bonne matière pour lui rendre cet hommage hebdomadaire : Open Data, visualisations et cartographie au menu ibérique.
Mi data es tu data “Datos.gob.es est le portail national qui gère et organise le catalogue de l’information publique de l’Administration générale de l’État”. Information aesthetics. Demonstrative. Business Graphics Library - Billion Dollar Graphics. FlowingData.
Projects and Experiments by FlowingData. The Best Data Visualization Projects of 2011. I almost didn't make a best-of list this year, but as I clicked through the year's post, it was hard not to. If last year (and maybe the year before) was the year of the gigantic graphic, this was the year of big data. Or maybe we've gotten better at filtering to the good stuff. (Fancy that.) In any case, data graphics continue to thrive and designers are putting more thought into what the data are about, and that's a very good thing. So here are my favorites from 2011, ordered by preference.
Visualizing.org. Visual.ly infographics. Factual Appearance Infographics - The Beauty Myths Chart Lays Out the Truth.