
Infographic Journal - A Collection of Great Infographics PowToon, free business presentation software animated video maker and PowerPoint alternative 10 Awesome Free Tools To Make Infographics Advertisement Who can resist a colourful, thoughtful venn diagram anyway? In terms of blogging success, infographics are far more likely to be shared than your average blog post. This means more eyeballs on your important information, more people rallying for your cause, more backlinks and more visits to your blog. Designing An Infographic Some great tips for designing infographics: Keep it simple! Ideas for infographic formats include: Timelines;Flow charts;Annotated maps;Graphs;Venn diagrams;Size comparisons;Showing familiar objects or similar size or value. Here are some great tutorials on infographic creation: Creating Your Infographic Plan and research.If required, use free software to create simple graphs and visualisations of data.Use vector graphic software to bring these visualisations into the one graphic. Ultimately, if you have a little design skill, the very best approach is to create all the simple graphs and illustrations yourself using vector graphic software. Stat Planet Hohli
Infographic Showcase For Tech + Social Media + SEO | Infographic Love Tools - Cool Infographics Adioma creates information graphics out of your textual data, using timelines, grids and icons. Create impressive charts from spreadsheets. Assemble into dashboards, embed in websites, or simply share a link. “데이터 시각화의 대세” 인포그래픽 제작 가이드 최근 데이터를 시각화한 인포그래픽(Infographics)이 큰 인기를 누리고 있으며, 일반적인 블로그 포스트나 기사보다는 소셜 미디어를 통해 공유될 가능성이 높아 잘 활용되고 있다. 인포그래픽은 이미지를 데이터와 결합해, 텍스트 또는 그래픽을 단독으로 사용하는 것 보다 유용하다. 사용자는 뉴스, 프레젠테이션, 기업 블로그 및 웹 사이트에서의 공식 발표 등에 인포그래픽을 활용해 대중의 관심을 끌면서 자신의 전문성을 과시할 수 있다. 과거에는 그래픽 디자이너를 채용하지 않았거나 예산이 넉넉하지 않은 기업들은 인포그래픽을 손쉽게 활용할 수 없었다. 하지만 온라인 차트와 지도 제작 툴 덕분에 이제는 모든 기업이 흥미로운 개념을 매력적인 인포그래픽으로 탈바꿈할 수 있게 되었다. 키스메트릭스(Kissmetrics)의 인포그래픽은 디자인과 데이터가 적절한 균형을 이루고 있다. 그래픽과 데이터를 현명하게 선택하라 모든 기업은 전문지식을 갖추고 있으며 전문지식은 흥미로운 작품 제작에 도움이 된다. 인포그래픽이 정확하게 어떤 모습을 띠며 정보가 어떻게 표현되는지를 결정하기 위해 와이어 프레임(Wireframe)이나 다른 수단을 동원해 웹 사이트를 기획하듯이 인포그래픽을 기획하면 좋다.
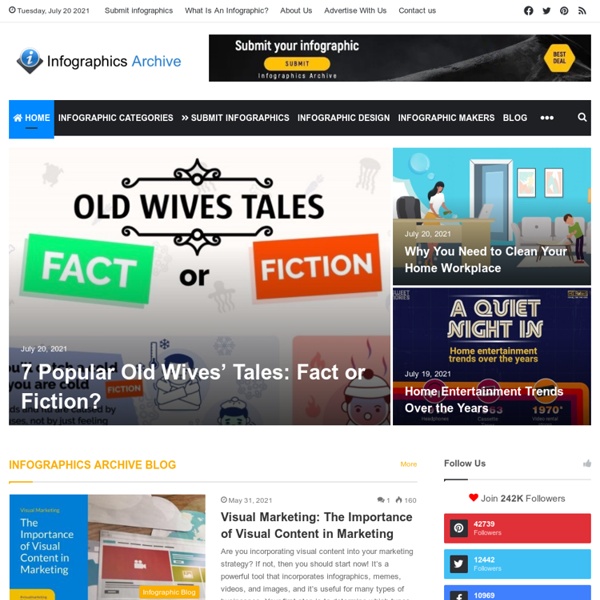
The cost of being Batman - Infographic by MoneySupermarket We've all wanted to be Batman at one time or another, but how much would it cost to actually become Batman? Of all the superheroes, Batman's wealth is significantly larger than most - with the possible exception of Tony Stark aka Iron Man. Wayne Manor costs $600,000,000 alone with an annual running cost of $37,000. Of course Batman hasn't saved or taken out a loan to build up his wealth. Take a look at our 'Cost of Being Batman' infographic and ask yourself if you could afford to become Batman! Image sources: Warner Brothers & DC Comics Digg Reddit StumbleUpon Embed this Infographic on your site: <a href=" src=" alt="" width="500" border="0" /></a><br /> Image source: <a href="
3 things the Joker has taught me about content marketing - NewsReach As an avid Batman fan, I thought Heath Ledger’s portrayal of the Joker in the Dark Knight was one of the most terrifying and brilliant examples of acting in modern cinema. He was also brutally honest in the movie and because of this I’d like to take some of his more famous lines from the movie and apply them to what content marketers have had to come to grips with recently. 1. “You wanna know how I got these scars…?” Every business has a past and at some point during that past it has had to struggle to survive. Some of the most interesting content on the internet discusses the hidden pitfalls in life, the small everyday processes that have become second nature and are filled with flaws. 2. What content cards have you got up your sleeve? I’ve said this before in my blogs and I say it regularly to clients: you need to be willing to step outside of your comfort zone with content. 3. As per usual, the toughest lesson is the last but it’s also the most important.
Notas