
La tavola periodica del Social Media Marketing [Infografica. Il Social Media Marketing lo amiamo, lo odiamo, lo analizziamo e lo studiamo.
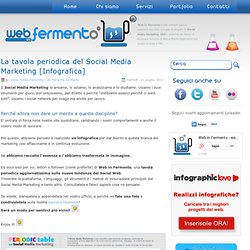
Usiamo i suoi strumenti per gioco, per entusiasmo, per diletto o perché “dobbiamo esserci perché ci sono tutti”. Usiamo i social network per svago ma anche per lavoro. Perché allora non dare un merito a questa disciplina? E’ entrata di forza nelle nostre vite quotidiane, cambiando i nostri comportamenti e anche il nostro modo di lavorare. Per questo, abbiamo pensato e realizzato un’infografica per dar merito a questa branca del marketing cosi affascinante e in continua evoluzione. Ne abbiamo raccolto l’essenza e l’abbiamo trasformata in immagine. Ed ecco solo per voi, lettori o follower (come preferite) di Web in Fermento, una tavola periodica aggiornatissima sulle nuove tendenze del Social Web.
Se volete, stampatela e appendetela nel vostro ufficio, e perché no fate una foto e condividetela sulla nostra bacheca Facebook! Enjoy it! Versione in alta risoluzione Rating: 5.0/5 (2 votes cast) How Do These Airlines Score According To Their Social Media. How are small businesses using Social Media? How to Evaluate Your Facebook Page. Population of the Dead. Nations15_50pct.jpg. Country_Continent_GDP_Population-Radial Convergence. Housing & Poverty. 013 - Transparency - Seeking Refuge. 26051202.jpg (2282×1397) [Infographic] Gamification with Market Research. Advanced fields like information technology have made the human life easy, in so many ways.
![[Infographic] Gamification with Market Research](http://cdn.pearltrees.com/s/pic/th/gamification-marketsandmarkets-64086742)
Increase use of technology in day-to-day lives of humans has also entered the essential practices like business research. Entrepreneurs, despite the size of their businesses believe in performing thorough analysis of the marketplace. This analysis offers them valuable details about their target customers competitors and latest market trends. The continued influence of computing technology and internet is evident in the changing researching practices of today. Experts from across the globe believe in relying on internet for a larger part of their survey. What is Gamification? Gamification has made news in various industry verticals since past few years. According to the experts, gamification helps researchers by drawing true and deepest emotions of the subjects, in this case- customers.
Design High Quality Infographics Templates with Venngage. 30 Useful Infographics for Designers & Developers. There aren't many better ways to gain information these days than infographics.
Infographics allow designers and non-designers to compile interesting, important and funny information all into one creative package. An infographic is meant to tell a story and provide information in a visually striking way. You can use an infographic to visually display statistics, facts, data, and anything else. Today, we've compiled a list of useful and funny infographics for both designers and develoeprs. You'll see things that will make you laugh, and infographics that you can use as a reference sheet on a daily basis. 8 Types Of Infographics & Which One To Use When. Whether you love them or hate them, infographics are still one of the most effective ways to present a lot of information in an interesting, concise and easily digestible way.
It’s much faster to get the gist of something by scanning an infographic than reading several paragraphs of text. There have been a lot of bad infographics presented over the past few years, but overall, I’m noticing that the quality is going up. Did you know there are different styles of infographics? Today I’d like to share the 8 types of infographics with you. Bitcoin-Infographic.jpg (JPEG Image, 1871 × 1420 pixels) - Scaled (54%) Infographic Design Presentation and Video Creation. Create Free Infographics Online. Animated Infographic Examples – Video Infographics Archives - Infographic Design Agency – Hire Expert Infographic Designers.
Are you looking for a video/animated infographic company?
We create professional video infographics and animations that will make an impact on your audience. Animation is where the world of communication is shifting, whether it’s animated infographics, whiteboard animations, or explainer videos. Video is just becoming the best way to enhance the customer experience, and get them to take action, leading to the ever-valuable conversion. Infographic World is the full-service, turnkey company that can help you bring your story to life through animation and help bring you to the next level. TeachersFirst: Now I See! - Infographics as content scaffold and creative, formative assessment.
Create Easy Infographics, Reports, Presentations. Free Infographic Maker - Venngage. 10 free tools for creating infographics. Done right, infographics can be a great way to make sense of complex data.
The best infographics transform complex information and data into graphics that are both easy to grasp and visually appealing. The only problem is, infographics that look like they were simple to make are often anything but. Exclusive offer: Save 15% on Adobe Creative Cloud now Here, we've selected our top free tools and apps for making infographics. Some of the options here are even suitable for non-designers, as templates and other features make them easy to use.
The Anatomy Of An Infographic: 5 Steps To Create A Powerful Visual. Information is very powerful but for the most bit it is bland and unimaginative.

Infographics channel information in a visually pleasing, instantly understandable manner, making it not only powerful, but extremely beautiful. Once used predominantly to make maps more approachable, scientific charts less daunting and as key learning tools for children, inforgraphics have now permeated all aspects of the modern world. I designed a couple of infographics back in college, the need arising especially around the time Soccer World Cup fever spiked. It was a fun process representing the different groups, predicting winners in each group at each stage and creating a mock pairing of teams that would clash all the way leading upto the finals. I was a devout Argentinian supporter at the time. Infographics can appear daunting to some with the sheer amount of data they present, but designed in the right manner and step by step, they can actually be one of the most fun things you will ever create.
Infographic Dos, Don’ts and Must-Haves. Infographics Published on August 22nd, 2013 | by Yael Grauer We live in an age of data, but visualizing that data and making it tell a story can be challenging: enter the infographic.
Presenting complex information visually makes it that much more digestible, which may explain why infographics have surged in popularity. In fact, a single infographic has the potential of being viewed by up to 15 million people, according to Top Marketing Schools and the field of data visualization is growing both within business and academia, media and elsewhere. Infographic: Is Social Media Ruining Students? - Nicholas Jackson. Infographics from Scratch. In this tutorial you will learn that data doesn't have to be boring, it can be beautiful!

Learn how to use various graph tools, illustration techniques and typography to make an accurate and inspiring infographic in Adobe Illustrator. Start by using the Rectangle Tool (M) to draw a shape. Give it a subtle radial gradient too. The entire design is based on a grid of four columns. To make the columns first select the rectangle and drag a guide onto the centre of the shape. Condense the shape so it fits within the left-most guide and centre guide. Move the shape over to the right and add another guide to the centre here. Using the Rectangle Tool (M) draw a thin white box on the centre line that will be the width of the gap between the columns. Repeat the process for the other columns with your final result being below. I like to place the most important graphics first and work-in the ancillary charts and graphs afterwards. Give the circles a variety of gradients.
How do You Design Good Infographics? Infographics are an interesting breed of dense information crammed into colorful cartoons and illustrations.
This trend started a few years back on the Internet and has grown into a steady resource for learning. People all around the world are consuming knowledge via these graphics – and they’re perfect for nearly any situation. But how did these things get so popular? Create infographics & online charts. How To Use Infographics on Facebook To Drive Engagement. Infographics resume. Infographic resume. Awesome Infographic Resume Service. 20 Animated And Interactive Infographics You Have To See. Everyone loves infographics, sure, but static infographics are a bit old hat now. With so many infographics out there, it’s easy to overlook a lot of infographics with good content just because they just don’t stand out from the rest of the pack.
And, if you’re a designer, you’ve probably racked your brains trying to figure out how to attract viewers and create infographics that do stand out from the rest. Video Infographics - Curated motion graphic video explanation and animated explainer videos that explain, educate, or inform. Piktochart- Infographic & Presentation Tool. 'infographics' in Creative teaching and learning. Layout Cheat Sheet for Infographics : Visual arrangement tips. This is part of our series on infographic design. Check out the other posts here! Good visual arrangement for infographics is putting together graphic and visual elements in a manner that draws your reader’s attention.
The key to achieving simple, elegant and attractive content are ample whitespace and a well arranged layout. White space is as its name suggests – space that is unmarked in a piece of infographic or visual representation. It could be margins, padding, or the space between columns, text, and icons and design elements. Whitespace matters in creating visually engaging content. Resume infographics. Evolution of the Internet Infographic. Resume infographic. Infographics. What Is An Infographic? Create Easy Infographics, Reports, Presentations. 8 Types Of Infographics & Which One To Use When. INFOGRAPHICS. 13 Reasons Why Your Brain Craves Infographics [HTML 5]
10 Astounding Infographics Comparing Money Matters Around the World. 47 Flares Google+ 2 Twitter 31 Facebook 4 Reddit 1 StumbleUpon 1 Pin It Share 0 LinkedIn 8 inShare8 47 Flares × It goes without the saying that comparing wealth and spending in different countries is almost impossible: people work, earn and even spend differently – moreover, their ways of life and views can be too different to compare. However, we still try to compare because people move around the world and they want to know what they can expect in different corners of the globe.
Here are the 10 greatest examples of information graphics comparing money, spending and earning around the world: 1. U.S. The most interesting finding of the stats research and the visualization: The U.S. is the clear leader in total annual spending, but ranks 9th in Science performance and 10th in Math. Note: It is unclear what was the measure used to compare the countries in their math and science performance. 2. Most Expensive Cities is the World is an interesting visualization by Home Loan Finder. 3. 4. 5. 6. 20 Examples Of Infographs That You Don’t See Every Day.
I think we all know what an infograph is, and nowadays they are increasingly popular. The bad thing is that almost all of them are becoming boring and very similar. In this article I have collected 20 infographs that are very unique design and also interesting subjects. Twitter Dots: Mapping all Tweets for a specific Keyword Twitter Dots translates individual tweets as simple dots on a geographical world map. It is as simple as that. 10 Astounding Infographics Comparing Money Matters Around the World. Big Data Infographic and Gartner 2012 Top 10 Strategic Tech Trends. By Ravi Kalakota Data, data and more data…data is everywhere…data is important… By 2015, nearly 3 billion people will be online, pushing the data created and shared to nearly 8 zettabytes. Centurylink created this cool infographic to highlight the data deluge and big data issues. Gartner 2012 Top 10 Tech Trends illustrated some examples of this. 30 billion pieces of content were added to Facebook this past month by 600 million plus users.Zynga processes 1 petabyte of content for players every day, a volume of data that is unmatched in the social game industry.More than 2 billion videos were watched on YouTube … yesterday.The average teenager sends 4,762 text messages per month.32 billion searches were performed last month … on Twitter.Worldwide IP traffic will quadruple by 2015 (Cloud is a big driver for this; most corporations are racing to upgrade networks and connectivity) Time for a strategy….
Like this: 20 must read Infograhics on Big Data. Cool Infographics - Blog. Jelly illustration. Infographic: bright lights of London’s West End. Broadway-infographic-970.png (PNG Image, 970 × 3886 pixels) - Scaled (25%) Infographics-Developing Visual Literacy. Artseducation_4faacdfc459f4.png (PNG Image, 1056 × 1632 pixels) - Scaled (61%) Music Sales, Piracy & Money Statistics infographic. Bitcoin-Infographic.jpg (JPEG Image, 1871 × 1420 pixels) - Scaled (54%) Design High Quality Infographics Templates with Venngage. Create Easy Infographics, Reports, Presentations. How to Create an Infographic in Under an Hour [10 Free Infographic Templates] Wouldn't it be great if creating infographics was as simple as writing regular ol' text-based blog posts? Unfortunately, the reality is that making visual content like this usually takes a lot more time, effort, and let's face it -- skill -- than the written word.
Usually. But considering the popularity and effectiveness of visual content in marketing today, you can't just afford to throw in the towel. That's why we decided to take all the pain and suffering out of infographic creation. Seriously -- don't throw in the towel just yet. Create Free Infographics Online. 50 Informative and Well-Designed Infographics. It’s impossible to comprehend complex data or analyze large amounts of information, if we only use words or texts. Evolution of Search Engine:Infographic History. 4 Simple Tools for Creating an Infographic Resume. This post originally appeared on the American Express OPEN Forum, where Mashable regularly contributes articles about leveraging social media and technology in small business.
As a freelancer or job seeker, it is important to have a resume that stands out among the rest — one of the more visually pleasing options on the market today is the infographic resume. An infographic resume enables a job seeker to better visualize his or her career history, education and skills. 10 Awesome Tools To Make Infographics. Infographic: How Much Are The Top Private Company Founders Worth? - SVW (Build 20110413222027) How Students Use Technology [INFOGRAPHIC] It's clear that today's students rely heavily on electronic devices even when they're not incorporated in the classroom. In one survey of college students, 38% said they couldn't even go 10 minutes without switching on some sort of electronic device. But how students are using their devices, how technology is affecting their educational experience, and what effect it has on their well-being are questions that are harder to answer.
In the infographic below, online higher education database Onlineeducation.net has summed up some of the existing research on these points. Infographics: 10 Beautiful Social Media Data Visualizations. What's happening in the world of social media? Infographic: Apple Users Donate More Than PC, Android Users. 30 Useful Infographics for Designers & Developers. Twitter Territory info graphic. The Growth Of Social Media [INFOGRAPHIC] The Top 10 Marketing Infographics Of 2011. Rare Earth Elements Infographic Shows the Impact of Resource Depletion on Green Technology. Infographic: Dogs vs. Cats. Infographic – The Darker Sides of Halloween » Anna's Halloween Costume Blog. The Android Story. [INFOGRAPHIC] 45 Years of Star Trek [Infographic] The Web Life of an Article. We Party Patriots » Blog Archive » Get a What? A Job? 70% of Occupy Wall Streeters are Employed, Compared to 56% of Tea Partiers.
What Are Websites Made Of? (Infographic) The evolution of SEO. 60 Seconds - Things That Happen On Internet Every Sixty Seconds [Infographic] (Build 20110413222027) 5 Great infographic Creation Tools for Teachers. Facts about cancer – infographic.
How Social Media Leads To Social Change [INFOGRAPHIC] Which Social Network Should You Use. 48 Significant Social Media Facts, Figures and Statistics - Plus 7 Infographics. 23% of Global Population Never Uses the Internet for Health Info [INFOGRAPHIC] Theater Business Costs & Earnings - How Much it Costs to Put on a Show.
Here's How The World's Most Brilliant People Scheduled Their Days. Owning Wild Animals: Stats on Exotic Pets (Infographic) The-most-expensive-pieces-of-art-infographic_509240c119a6c.jpg (JPEG Image, 926 × 7370 pixels) - Scaled (13%) A costume for every era.