
Svg - Read Path and draw circles. Paths – SVG 1.1 (Second Edition) Contents 8.1 Introduction Paths represent the outline of a shape which can be filled, stroked, used as a clipping path, or any combination of the three.
(See Filling, Stroking and Paint Servers and Clipping, Masking and Compositing.) A path is described using the concept of a current point. In an analogy with drawing on paper, the current point can be thought of as the location of the pen. Paths represent the geometry of the outline of an object, defined in terms of moveto (set a new current point), lineto (draw a straight line), curveto (draw a curve using a cubic Bézier), arc (elliptical or circular arc) and closepath (close the current shape by drawing a line to the last moveto) elements. This chapter describes the syntax, behavior and DOM interfaces for SVG paths. Converting SVG Path to Polygon. Three Little Circles. Once upon a time, there were three little circles.
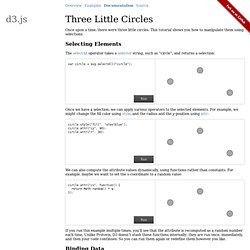
This tutorial shows you how to manipulate them using selections. Selecting Elements The selectAll operator takes a selector string, such as “circle”, and returns a selection: var circle = svg.selectAll("circle"); Once we have a selection, we can apply various operators to the selected elements. Circle.style("fill", "steelblue"); circle.attr("cy", 90); circle.attr("r", 30); We can also compute the attribute values dynamically, using functions rather than constants.
Circle.attr("cx", function() { return Math.random() * w; }); If you run this example multiple times, you’ll see that the attribute is recomputed as a random number each time. Binding Data. Examples. This example demonstrates loading of CSV data, which is then quantized into a diverging color scale. The values are visualized as colored cells per day. Days are arranged into columns by week, then grouped by month and years. 1.3.5 demo - jQuery. Svgweb - Scalable Vector Graphics for Web Browsers using Flash. Overview SVG Web is a JavaScript library which provides SVG support on many browsers, including Internet Explorer, Firefox, and Safari.
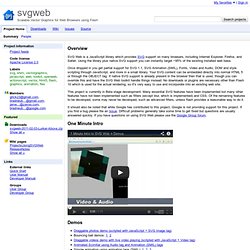
Using the library plus native SVG support you can instantly target ~95% of the existing installed web base. Once dropped in you get partial support for SVG 1.1, SVG Animation (SMIL), Fonts, Video and Audio, DOM and style scripting through JavaScript, and more in a small library. Your SVG content can be embedded directly into normal HTML 5 or through the OBJECT tag. If native SVG support is already present in the browser then that is used, though you can override this and have the SVG Web toolkit handle things instead. Dynamic Learning Maps. Paul Horner (Friday, 28th May, 2010 (2:27 p.m.))
I've been delving into the murky world of mind mapping solutions for use within Learning Maps. The existing freemind tool we're using is great - it allows us to draw the Dynamic Learning Map as a navigable mind-map really easily and I think it's fairly usable. It certainly seems really intuitive to me anyway! However, there is a small issue with it - it relies on Flash. Despite being available to 95%+ of web users, Flash causes us a number of problems - it's a proprietary format which means that our development is very much in the hands of Adobe, and many newer mobile devices (and I'm speaking specifically about the iPhone and iPad) don't support it. Freemind does come with a Java version, but by all accounts that's pretty slow and I'm not sure if that in itself will solve the problem of having to rely on 3rd party plugins.
One suggestion that has been put forward to the Freemind developers was to allow the map to be displayed using SVG. Build XML-Based Images in ASP.NET Using Scalable Vector Graphics. Vector Graphics Build Flexible, Lightweight XML-Based Images for ASP.NET Using Scalable Vector Graphics Dennis Forbes This article assumes you're familiar with HTML, ASP.NET, and C# Scalable Vector Graphics (SVG), a W3C graphics standard built around XML, is one of several vector graphics technologies that allows fast, lightweight drawings such as charts and graphs to be rendered on the fly in an appropriate viewer. There are many advantages to such vector graphics, including conservation of bandwidth and storage media, and flexibility.
Creating dynamic SVG elements in JavaScript « Joseph's RIA Lab. While I was working on a HTML5 project I found this problem of creating SVG (Scalable Vector Graphics) elements dynamically in JavaScript.
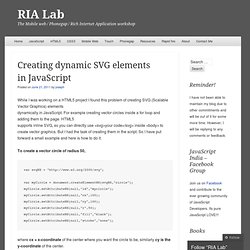
For example creating vector circles inside a for loop and adding them to the page. HTML5 supports inline SVG, so you can directly use <svg>your code</svg> inside <body> to create vector graphics. But I had the task of creating them in the script. Making an Interactive SVG London Tube Map with Raphael JS. Update: I have made a functional demo of this over here Is there an easy way to convert this increasingly mammoth tube map into a clean, cross browser, interactive map?

The short answer is…. no, but here’s how anyway. Allow me to explain why. I’m sure someone will find this post and tell me straight away that I could’ve done this using a much simpler approach, but this is how I tackled it. Firstly, get the right Tube Map.