
Agent-Based Computational Economics (Tesfatsion) Growing Economies from the Bottom Up ACE Overview ACE Modeling Principles Real-world economies exhibit five essential properties.
First, real-world economies consist of heterogeneous interacting entities encapsulating distinct states (data, attributes, methods). Second, real-world economies are open-ended dynamic systems whose dynamics are driven by the successive interactions of their participant entities. Taken together, these five essential properties imply that real-world economies are locally-constructive sequential games.
Roughly defined, ACE is the computational modeling of economic processes (including whole economies) as open-ended dynamic systems of interacting agents. More precisely, the ACE modeling approach is characterized by the seven modeling principles listed below. (MP1) Agent Definition: An agent is a software entity within a computationally constructed world capable of acting on the basis of its own state, i.e., its own internal data, attributes, and methods.
FactoMineR: Exploratory Multivariate Data Analysis with R. Extract and Visualize the Results of Multivariate Data Analyses. Factoextra is an R package making easy to extract and visualize the output of exploratory multivariate data analyses, including: There are a number of R packages implementing principal component methods.
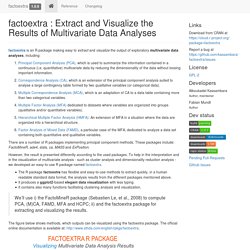
These packages include: FactoMineR, ade4, stats, ca, MASS and ExPosition. However, the result is presented differently according to the used packages. Factoextra R Package: Easy Multivariate Data Analyses and Elegant Visualization. Factoextra is an R package making easy to extract and visualize the output of exploratory multivariate data analyses, including: There are a number of R packages implementing principal component methods.
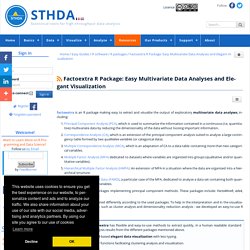
These packages include: FactoMineR, ade4, stats, ca, MASS and ExPosition. However, the result is presented differently according to the used packages. To help in the interpretation and in the visualization of multivariate analysis - such as cluster analysis and dimensionality reduction analysis - we developed an easy-to-use R package named factoextra. The R package factoextra has flexible and easy-to-use methods to extract quickly, in a human readable standard data format, the analysis results from the different packages mentioned above.It produces a ggplot2-based elegant data visualization with less typing.It contains also many functions facilitating clustering analysis and visualization. Voyant Tools. StatWiki. Tutorials, Programs, Code Examples, Questions and Answers, MCQs for IT Students and Professionals. Datasets for Data Mining and Data Science. See also Data repositories Anacode Chinese Web Datastore: a collection of crawled Chinese news and blogs in JSON format.
AssetMacro, historical data of Macroeconomic Indicators and Market Data. Awesome Public Datasets on github, curated by caesar0301. Scikit-learn: machine learning in Python — scikit-learn 0.20.0 documentation. Data Mining: Practical Machine Learning Tools and Techniques. Machine learning provides practical tools for analyzing data and making predictions but also powers the latest advances in artificial intelligence.
Our book provides a highly accessible introduction to the area and also caters for readers who want to delve into modern probabilistic modeling and deep learning approaches. Chris Pal has joined Ian Witten, Eibe Frank, and Mark Hall for the fourth edition of the book, and his expertise in these techniques has greatly extended its coverage.
The book's online appendix provides a reference for the Weka software. Mark Hall on Data Mining & Weka. STHDA - Home. Linear Regression Essentials in R Linear regression (or linear model) is used to predict a quantitative outcome variable (y) on the basis of one or mult...
Interaction Effect in Multiple Regression: Essentials This chapter describes how to compute multiple linear regression with interaction effects. Previously, we have describ... Data Blog. Elements of Statistical Learning: data mining, inference, and prediction. 2nd Edition. Index. Learning From Data - Online Course (MOOC) A real Caltech course, not a watered-down version on YouTube & iTunes.
Forums. Internet World Stats - Usage and Population Statistics. Introduction to K-means Clustering. Prerequisites Experience with the specific topic: NoviceProfessional experience: No industry experience Knowledge of machine learning is not required, but the reader should be familiar with basic data analysis (e.g., descriptive analysis) and the programming language Python.
To follow along, download the sample dataset here. Introduction to K-means Clustering K-means clustering is a type of unsupervised learning, which is used when you have unlabeled data (i.e., data without defined categories or groups). The centroids of the K clusters, which can be used to label new dataLabels for the training data (each data point is assigned to a single cluster) Rather than defining groups before looking at the data, clustering allows you to find and analyze the groups that have formed organically. Each centroid of a cluster is a collection of feature values which define the resulting groups. An Introduction to merTools. Jared Knowles and Carl Frederick Introduction Working with generalized linear mixed models (GLMM) and linear mixed models (LMM) has become increasingly easy with the advances in the lme4 package recently.
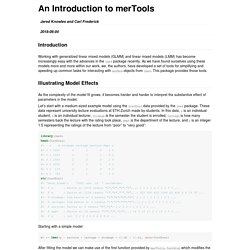
As we have found ourselves using these models more and more within our work, we, the authors, have developed a set of tools for simplifying and speeding up common tasks for interacting with merMod objects from lme4. This package provides those tools. Illustrating Model Effects As the complexity of the model fit grows, it becomes harder and harder to interpret the substantive effect of parameters in the model. Let’s start with a medium-sized example model using the InstEval data provided by the lme4 package. Package merTools. K-means clustering. The problem is computationally difficult (NP-hard); however, there are efficient heuristic algorithms that are commonly employed and converge quickly to a local optimum.
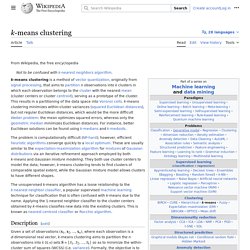
These are usually similar to the expectation-maximization algorithm for mixtures of Gaussian distributions via an iterative refinement approach employed by both k-means and Gaussian mixture modeling. Additionally, they both use cluster centers to model the data; however, k-means clustering tends to find clusters of comparable spatial extent, while the expectation-maximization mechanism allows clusters to have different shapes.
The algorithm has a loose relationship to the k-nearest neighbor classifier, a popular machine learning technique for classification that is often confused with k-means due to the k in the name. One can apply the 1-nearest neighbor classifier on the cluster centers obtained by k-means to classify new data into the existing clusters. Description[edit] where μi is the mean of points in Si. . , with. Complexity map castellani map of complexity science. Reviews and Top Software at Capterra.
The R Stats Package. Documentation for package ‘stats’ version 3.6.0 Help Pages ABCDEFGHIKLMNOPQRSTUVWXmisc. Model Fitting · Data Science with R. Summary: Laws look like continuous sequences of points in data, but models look like noisy clouds of points. As a result, it is much harder to reverse engineer a model from data than it is to reverse engineer a law. How should we pick the model that best describes the data? We can use inverse probability, or likelihood to find the model that is most likely to have generated the data. This allows us to fit many different types of models. SAS/ETS 14.3 User's Guide Documentation Examples. Calling Bullshit — Syllabus.
Logistics Course: INFO 198 / BIOL 106B. University of Washington To be offered: Autumn Quarter 2017 Credit: 3 credits, graded Enrollment: 180 students Instructors: Carl T. Bergstrom and Jevin West Synopsis: Our world is saturated with bullshit. Learn to detect and defuse it. Learning Objectives Our learning objectives are straightforward. Remain vigilant for bullshit contaminating your information diet. We will be astonished if these skills do not turn out to be among the most useful and most broadly applicable of those that you acquire during the course of your college education. FlowingData. Freakonomics - The hidden side of everything Freakonomics. GMK. Data Mining Map. Decision Tree. Making a Correlation Matrix in R. This tutorial is a continuation of making a covariance matrix in R.
These tutorials walk you through the matrix algebra necessary to create the matrices, so you can better understand what is going on underneath the hood in R. Data Mining - Entropy (Information Gain) [Gerardnico] Entropy is a function “Information” that satisfies: Petri Nets World: Online Services for the International Petri Nets Community. Recent News in the Petri Nets World. Home. Analytics Discussions.