
JavaScript Charts and Maps. 40+ Visualization Tools for dashboards and social business. There is so much data that it is an incredible task to actually comprehend it.
Like looking at a TV screen full of static… trying to rationalize if one pixel means something. Over 100 Incredible Infographic Tools and Resources (Categorized) This post is #6 in DailyTekk’s famous Top 100 series which explores the best startups, gadgets, apps, websites and services in a given category.

Total items listed: 112. Time to compile: 8+ hours. Follow @DailyTekk on Twitter to make sure you don’t miss a week! Data Visualization with D3.js. The 50 Most Important Rules of Document Design: Color CRAYON-TIP Method – The Visual Communication Guy: Designing, Writing, and Communication Tips for the Soul. Graphic design, for those who are not designers, often seems a difficult task to master.
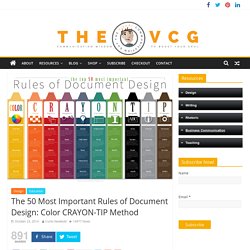
Aren’t there thousands of rules that apply to colors, typefaces, layouts, user experience, and so forth? Well, yes, technically. But the reality is, designing successful documents can be stripped down to just a few basic principles. NVD3. The Best Tools for Visualization. Microsoft Office Icons (ImageMSO) Gallery & Extraction - Home. Description Microsoft Excel Add-In to browse and save icons from Microsoft Office.Includes a compilation of 8,899 image names and a library for use with Excel development.
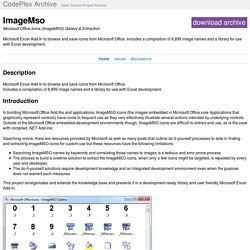
Introduction In building Microsoft Office Add-Ins and applications, ImageMSO icons (the images embedded in Microsoft Office core Applications that graphically represent controls) have come to frequent use as they very effectively illustrate several actions intended by underlying controls. "Office 2010 Add-In: Icons Gallery" - How to extract icons from backstage tab (docx) The Art of Complex Problem Solving. Announcing availability of SharePoint Server 2016 IT Preview and cloud hybrid search. Today’s post was written by Bill Baer, senior technical product manager for the SharePoint team.
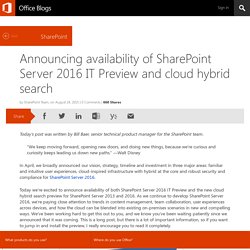
Office Blogs - How the Lotus F1 Team uses DevOps and the Microsoft Cloud. Yung Chou welcomes Mark Everest from the Lotus F1 team as they discuss how they integrate a DevOps culture in their organization along with Microsoft Cloud solutions like Azure, Office 365 and Dynamics to deliver winning results on and off the track. [3:47] Let’s talk about the Lotus F1 team and more specifically how does the Information Systems org support racing?

[10:30] Describe some of the challenges your team faces.[12:04] What Microsoft solutions do you use and how is DevOps relevant in your day to day operation? [15:15] Do you have any best practices you can share with the audience? [17:24] What’s next for you and your team? Experience Microsoft's latest products with these FREE downloads! Develop Windows 10 IoT apps on Raspberry Pi 2 and Arduino. Dot Net Tips & Tricks , C# (C Sharp)Tips & Tricks: Using Vb.Net Function in VBA.
How to use a VB.Net DLL/TLB in Excel VBA Here is an example for using the customized .NET Function in Excel VBA.
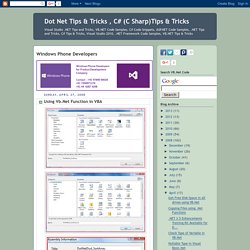
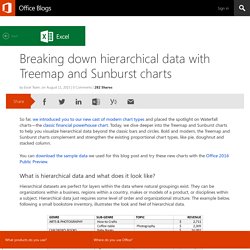
Unfortunately EXcel VBA doesn't have a Array.Sort function. Launchpad. Banshee. Breaking down hierarchical data with Treemap and Sunburst charts. So far, we introduced you to our new cast of modern chart types and placed the spotlight on Waterfall charts—the classic financial powerhouse chart.
Infographics. Infographics tools. InfoGraphic Designs: Overview, Examples and Best Practices. 10 Awesome Free Tools To Make Infographics. Advertisement Who can resist a colourful, thoughtful venn diagram anyway?

In terms of blogging success, infographics are far more likely to be shared than your average blog post. This means more eyeballs on your important information, more people rallying for your cause, more backlinks and more visits to your blog. In short, a quality infographic done well could be what your blog needs right now. 100 Diagrams That Changed the World. Since the dawn of recorded history, we’ve been using visual depictions to map the Earth, order the heavens, make sense of time, dissect the human body, organize the natural world, perform music, and even concretize abstract concepts like consciousness and love. 100 Diagrams That Changed the World (public library) by investigative journalist and documentarian Scott Christianson chronicles the history of our evolving understanding of the world through humanity’s most groundbreaking sketches, illustrations, and drawings, ranging from cave paintings to The Rosetta Stone to Moses Harris’s color wheel to Tim Berners-Lee’s flowchart for a “mesh” information management system, the original blueprint for the world wide web.
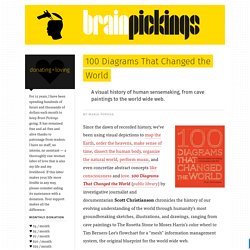
It appears that no great diagram is solely authored by its creator. Most of those described here were the culmination of centuries of accumulated knowledge. Infographic: How to Use Colors in Graphic and Web Designing. Over 100 Incredible Infographic Tools and Resources (Categorized) 15 Useful Infographics For Designers And Developers. Writen by Bogdan / Comments Off on 15 Useful Infographics For Designers And Developers Information graphics or infographics are graphic visual representations of information, data or knowledge. These graphics present complex information quickly and clearly,[1] such as in signs, maps, journalism, technical writing, and education.
Screenlets. I just call them my little ones, but look at the official wording, what is the screenlet: „Screenlets are small owner-drawn applications (written in Python) that can be described as "the virtual representation of things lying/standing around on your desk". Sticknotes, clocks, rulers, ... the possibilities are endless. The goal of the Screenlets base-classes is to simplify the creation of fully themeable mini-apps that each solve basic desktop-work-related needs and generally improve the usability and eye-candy of the modern composited Linux-desktop. More Of The Best Linux Screenlets. Many users are already familiar with the advantages that Screenlets can offer, so I decided to seek out which ones were essential to the productivity and aesthetics of any desktop. Screenlets are small community created Python applications that can add style and functionality to your Linux desktop. AngularJS.