
The child poverty gap by race and ethnicity has shrunk in the US. In a recent report, I called attention to the substantial decline in poverty among children in the United States over the past half century, which contradicts much of what the popular media and some elected officials like to say.
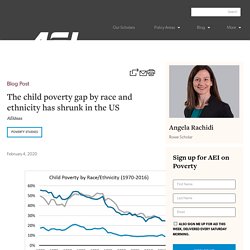
As I noted, proper measurements show that US child poverty has fallen by at least 50 percent since the 1980s, and likely more. The gap in child poverty rates by race and ethnicity is similarly misrepresented by scholars and commentators. In a 2019 article from the journal, Population Research and Policy Review, the author concluded that: What Government Poverty Statistics Leave Out. While pressing her agenda to expand means-tested welfare programs, Democratic Congresswoman Alexandria Ocasio-Cortez is claiming that the federal government’s poverty statistics vastly undercount the number of Americans who are “destitute.”
In reality, the exact opposite is true because those statistics omit a broad range of government benefits, charity, and unreported income. When these are counted, the poorest fifth of U.S. households consume five times more goods and services than the poverty stats reveal. No, Millions of Americans Are Not Living on Less Than $2 a Day. Over the past five years some welfare advocates have been promoting an eye-opening claim: more than 3 million U.S. households—including 1.65 million households with children—are living on less than $2 per person, per day.
That sounds horrific, and it is: horrifically misleading. New research published by the National Bureau of Economic Research (NBER) finds that more than 90 percent of the 3.6 million non-homeless that had previously been classified as living in extreme poverty were misclassified. Shockingly, more than half of all misclassified households have incomes above the poverty line, and several of the largest misclassified groups appear to be at least middle class based on measures of material well-being. The new research also includes benefits to households, such as the Supplemental Nutrition Assistance Program (SNAP) and Special Supplemental Nutrition Program for Women, Infants, and Children (WIC). Extreme poverty in America still exists, of course. (Via: Reason) The Irrelevance of That “3 Billionaires Have More Wealth Than Half of America” Factoid. Factoids are everywhere.

They are those quotable statistics people use to defend their beliefs or undermine another’s. Unfortunately, factoids aren’t always accurate or fair. On The Prevalence Of "Extreme Poverty" In The United States. The World Bank has a definition of “extreme poverty,” which, in their formulation, means “living on less than $1.90 per day.”
I have no idea how they picked the figure of $1.90 for the cutoff, but that certainly is a very low figure. Parsing the definition a little, notice that they use the term “living on” as the standard, rather than saying, for example, that a person has less than $1.90 per day in “income.” As you will see, the difference is significant. Anyway, the WB in its most recent (April 2019) report on this subject gives a figure of about 10% of the world’s population, or 736 million people, as “living on” resources below that very low $1.90 per day level per capita. 3 Common Myths about Income Inequality Debunked. Deep in the weeds: A tale of two poverty measures. How The New York Times And Washington Post Do "Poverty" — Manhattan Contrarian. My post this past Sunday took note of a prominent Wall Street Journal op-ed last week that drove home some points that I have been making here for a few years about the measurement and incidence of “poverty” in the U.S.
Most important is the systematic exclusion of some $1.2 trillion of government redistributions, $500 million of private charity, and as much as $2 trillion of underground economy from the incomes of lower income people when “poverty” is measured and reported. Since these three categories, in the aggregate, come to a large multiple of the amount that ought to be sufficient to eliminate all poverty under the government’s definition, I have long asserted that the government “poverty” data are systematically fraudulent, misleading, and useless for their intended purpose.
That does not mean, of course, that there are no people in the U.S. who remain in difficult economic circumstances even after all the redistributions. Census data released today show continued gains for middle-class Americans and little evidence of rising income inequality. The Census Bureau released its annual report today on “Income and Poverty in the United States: 2017” with lots of new, updated data on household and family incomes, and household demographics through 2017.
Below are four charts with commentary based on the new Census data on household income through 2017. Shortly I’ll post my annual analysis “Explaining US income inequality by household demographics,” here’s my post from a year ago for 2016 data. 1. Median and Average Household Income, and Average Household Size. The chart above shows: a) average annual household income in 2017 dollars (light blue line), b) median household income in 2017 dollars (dark blue line), and c) average household size (brown line), all from 1975 to 2017.
Median household income last year of $61,372 was an increase of 1.8% from 2016 and brought median income for US households to the highest level ever, above the previous record level last year of $60,309. 2. 3. 4. A. B. 5. Max Roser sur Twitter : "Share of the Chinese population living in extreme poverty 1981: Almost all (88%) 2013: Almost no one (2%) [In our entry you can read about how extreme poverty is defined and measured. And how it changed around the world and why: h. What the UN Gets Wrong About Poverty. Philip Alston, the United Nations Special Rapporteur on extreme poverty, is coming to the UK soon to tell us all how meanly we treat the less fortunate in our society.
He’s got a bit of a record on such matters, as his report on poverty in the US showed. In his initial report, he tried to measure poverty without taking into account all the things the US government does do to reduce it, which really is not the way to do it. His second stab at it made a different mistake—it didn’t try to measure poverty at all, it measured inequality. Inequality is doubtless an interesting thing, but it’s important not to get the two concepts confused with each other. Inequality isn’t poverty and poverty ain’t inequality. Let's Start Defining Terms What everyone is actually talking about is relative poverty, living on less than 60 percent of median household income. At which point perhaps we’d better point out what poverty is. This sort of poverty does not exist in today’s UK. This isn’t, of course, true. Inequality Is the Wrong Indicator - Why We Should Focus on Poverty Instead. One of the most talked-about social issues today is inequality.
Numerous media outlets from CNBC to Brazil’s Jornal O Globo have published the results of Oxfam’s global report on inequality which alleges an ever-rising gap between the rich and the poor. In its 2018 report, Oxfam claims that “82% of all growth in global wealth in the last year went to the top 1%, while the bottom half of humanity saw no increase at all”; “New data from Credit Suisse means 42 people now own the same wealth as the bottom 3.7 billion people”; and “Over the last decade, ordinary workers have seen their incomes rise by an average of just 2% a year, while billionaire wealth has been rising by 1% a year – nearly six times faster,” among others.
However, before flipping the table and occupying Wall Street, we should take a closer look at what these figures really mean. New Research on Persistent Poverty and Joblessness in the US. Mapping Extreme Poverty Around the World. A new report from the World Bank just landed, finding that a record low of 10% of humanity now live in extreme poverty, down from 11% in 2013.
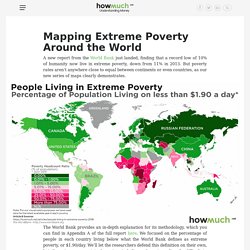
But poverty rates aren’t anywhere close to equal between continents or even countries, as our new series of maps clearly demonstrates. The World Bank provides an in-depth explanation for its methodology, which you can find in Appendix A of the full report here. We focused on the percentage of people in each country living below what the World Bank defines as extreme poverty, or $1.90/day. We’ll let the researchers defend this definition on their own, but there is one caveat to keep in mind. It can be extraordinarily difficult to collect reliable data from so many countries on a regular basis, and in fact we used the latest year in which numbers were available whenever possible.