
Tips & Tricks: Alternatives to Count Distinct. Skip to main content Tips & Tricks: Alternatives to Count Distinct inShare May 24, 2013 - 12:43pm By Daniel Hom Distinct counts are critical to analytics, whether it's counting individual patients in a hospital, the number of unique retail transactions, or the number of airplanes in a fleet.

First off, a short bit on how count distinct works. Power Tools For Tableau. We’re starting a blog series dedicated to helping you improve the performance of Tableau in your environment.
It all starts with the Best Practice Analyzer from Workbook Tools for Tableau. This feature lets you know exactly how you can improve your Tableau workbooks to run faster and smoother. Each post in the series is related to specific performance issues that are flagged by the Best Practice Analyzer. If you don’t have it yet, get it. Let’s begin by talking about the pros and cons of Custom SQL connections. Power Tools For Tableau. We’re starting a blog series dedicated to helping you improve the performance of Tableau in your environment.
It all starts with the Best Practice Analyzer from Workbook Tools for Tableau. This feature lets you know exactly how you can improve your Tableau workbooks to run faster and smoother. Each post in the series is related to specific performance issues that are flagged by the Best Practice Analyzer. Extract API Connecting to Web Datasources. Data Engine API. Custom Tableau Server Admin Views.
Home .
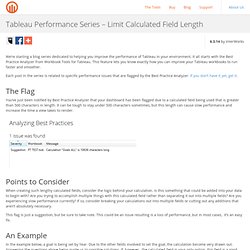
Support . Community . Tableau Workbook Library Currently Being Moderated Description: Custom Tableau Server admin views for monitoring usage and data server stats. Custom Tableau Server Admin Views. NASA: Industrial civilization headed for ‘irreversible collapse’ By Nafeez Ahmed, The GuardianFriday, March 14, 2014 23:42 EDT Natural and social scientists develop new model of how ‘perfect storm’ of crises could unravel global system A new study sponsored by NASA’s Goddard Space Flight Center has highlighted the prospect that global industrial civilisation could collapse in coming decades due to unsustainable resource exploitation and increasingly unequal wealth distribution.

Noting that warnings of ‘collapse’ are often seen to be fringe or controversial, the study attempts to make sense of compelling historical data showing that “the process of rise-and-collapse is actually a recurrent cycle found throughout history.” Cases of severe civilisational disruption due to “precipitous collapse — often lasting centuries — have been quite common.” It finds that according to the historical record even advanced, complex civilisations are susceptible to collapse, raising questions about the sustainability of modern civilisation: Surviving progress. Margaret Atwoodauthor “Instead of thinking that nature is this huge bank that we can just, this endless credit card that we can just keep drawing on, we have to think about the finite nature of that planet and how to keep it alive so that we too may remain alive.

Unless we conserve the planet, there isn’t going to be any “the economy”.” Enio Beatasawmill owner “The people responsible for destroying the Amazon are the big farmers, the international corporations. The biggest farmers are senators, deputies, colonels. Michael Hudson: Ironfisted oligarchy is wrecking country after country. Surviving Oligarchy. IMF Warns Inequality Is a Drag on Growth. China's oil pipelines riddled with defects. A nationwide overhaul of oil pipelines launched after a fatal explosion in Qingdao, Shandong province, has found hazards in many areas that could lead to similar incidents, according to the country's top work safety watchdog.

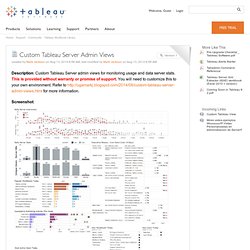
The overhaul was launched after oil leaked into sewage pipes where it exploded to kill 62 people in Qingdao on Nov 22, and has detected faults such as aging pipes and overlapping pipelines for oil and sewage, said Huang Yi, spokesman for the State Administration of Work Safety. "Some of the problems are staggering and some hazards are found everywhere," he said, adding that many oil pipelines are more than 40 years old and suffer from erosion and weakening. The country currently has more than 655 oil lines in service, measuring 102,000 kilometers in total. The watchdog has ordered all the potential dangers to be rectified, he said. Working with Stored Procedures and Functions. Beginning with Tableau 8.1, you can use stored procedures directly from Tableau.
For more information, refer to the Stored Procedures topic in the Desktop Help. If you are using an earlier version, although Tableau cannot query stored procedures directly, you can take advantage of programmability features in certain databases to work around this constraint. Microsoft SQL Server In Microsoft SQL Server, you can use the OPENQUERY function to invoke a stored procedure. This approach requires the following setup: Configure one SQL Server instance to act as a pass-through. In this scenario, your Tableau Custom SQL connection would look like the following: SELECT * FROM OPENQUERY(SALESDB, 'EXEC [Sales]. This statement selects from a built-in function OPENQUERY, the purpose of which is to trigger remote code. Example of stored procedure in SQL Server. Ransom Notes - Bhavna Mehta.
It’s your round at the bar… In this post, drawing some circular inspiration from the front cover of David McCandless’ Information Is Beautiful, I’m going to take a simple bar chart and wrap it around a circle, for no other reason than to see if it can be done in Tableau.
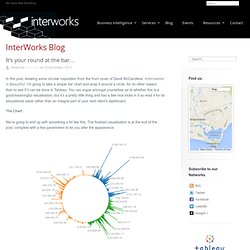
You can argue amongst yourselves as to whether this is a good/meaningful visualisation, but it’s a pretty little thing and has a few nice tricks in it so read it for its educational value rather than an integral part of your next client’s dashboard. The Chart We’re going to end up with something a bit like this. The finished visualisation is at the end of the post, complete with a few parameters to let you alter the appearance.
Overview We will be using Tableau’s line drawing capabilities to draw our graph, so we will need two points for each bar, one positioned on an inner circle and one extending outwards along the same angle. Drawing the green bar requires us to know the two radii and the angle on which the bar is projected. Step 1: The Data. Welcome. (23) Icons: What's the best looking and most extensive free icon library for wireframing. Creating a correlation matrix in Tableau using R or Table Calculations « Bora Beran. Correlation matrices offer a good way of visualizing similarities between members in your dataset.
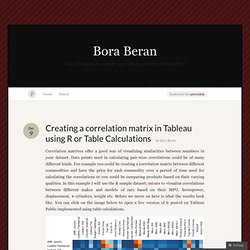
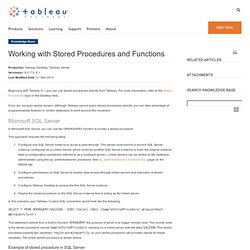
Data points used in calculating pair-wise correlations could be of many different kinds. For example you could be creating a correlation matrix between different commodities and have the price for each commodity over a period of time used for calculating the correlations or you could be comparing products based on their varying qualities. In this example I will use the R sample dataset; mtcars to visualize correlations between different makes and models of cars based on their MPG, horsepower, displacement, # cylinders, weight etc. Before we move on here is what the results look like.
You can click on the image below to open a live version of it posted on Tableau Public implemented using table calculations.