
RHSD - Column Totals in Tableau can be difficult to understand. Stumped by a blending problem where the column total for a blended calculation was zero, I called on my friend Joe Mako.

Exceptionally generous with his time & knowledge, Joe helped me to understand: what at first had seemed to be a simple confusion was actually various roadblocks in Tableau that each require some effort to understand & work around. Summarizing the knowledge I received from Joe, I'd like to thank him again for his generosity! All of the packaged workbooks are attached to my forum question, which is here: The first bit of insight is that column totals can generally be thought of as a semi~separate worksheet. This is especially true for automatic totals. In many ways, automatic column totals behave like a TOTAL() calculation. This is an important concept, one that plays into the solution and one that Curtis Harris has also hinted at with his clever method for improving the grand totals on a bar chart. Formatting Time Durations in Tableau. This post was updated on 24 July 2015 to include additional details on applying the custom formatting calculation to aggregates.

Here’s a quick lunchtime post on working with durations in Tableau. By duration, I mean having a result that is showing the number of seconds, minutes, hours, and/or days in the form of dd:hh:mm:ss. This isn’t quite a built-in option, there are a several ways to go about this: Use any duration formatting that is supported in your data source, for example by pre-computing values or using a RAWSQL function.Do a bunch of calculations and string manipulations to get the date to set up.
I prefer to avoid these mainly because they can be over 1000x slower than numeric manipulations. Jonathan's Teachings re: Table Calculations &am... This came from a thread I didn't want to lose: Taking a step back here, the question is about comparing across records in the underlying data in order to filter out Email IDs that belong to list 123, then count the remaining Email IDs per List ID.
This kind of problem is a great practice for me to explain, so I'll take a little extra time to walk through the steps involved to reach a couple of solutions. A distinct record (row) in the data is made of the Email Address and List ID. So if we want to exclude certain Email IDs based on the presence of a List ID for that record, we have to look across records. String Calculations in Tableau. The King James Bible goes Tableau – A (simple) Use Case Before I am coming to the very bone-dry and lengthy explanations of string calculations in Tableau, I felt I should do something motivating to get started: a small Tableau visualization putting at least one or two string formulas to practice.

Here it is. The Good Book goes Tableau. Functions. EVERYONE WILL USE ME - Tyler. Slicing by Aggregate. Update: These options are good if you are using Tableau 8.3 or earlier.
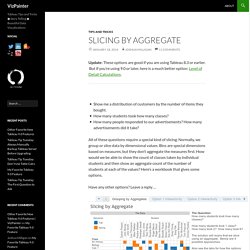
But if you’re using 9.0 or later, here is a much better option: Level of Detail Calculations. Show me a distribution of customers by the number of items they bought.How many students took how many classes? Average Number of Records per Hour per Weekday. Hi Bill, I'm working on my Think Data Thursday presentation for next week and found your post and it's a really good example of some things I'll be presenting, so I'm going a little long in my write-up here.
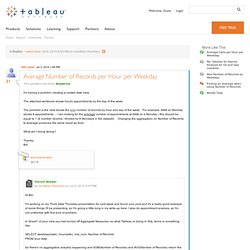
I also do appointment analysis, so I'm not unfamiliar with this kind of problem. In Sheet1 of your view you had turned off Aggregate Measures, so what Tableau is doing in SQL terms is something like: SELECT weekday(date), hour(date), row_num, Number of Records FROM your data So there's no aggregation actually happening and SUM(Number of Records) and AVG(Number of Records) return the exact same value, 1, and since Tableau by default stacks marks in a bar chart what you're seeing for Monday at 8am is 8 records with a value of 1.
As a general rule, turning off Aggregate Measures is only useful if you explicitly want to see every record in your data source plotted without any aggregation applied. If we want to count those Mondays as 0 visits, then we have to tell Tableau they do exist. Want to Learn Table Calculations? Here’s How! Going beyond Tableau’s built-in Quick Table Calculations can be challenging, and help you progress along the path of the Tableau Jedi.
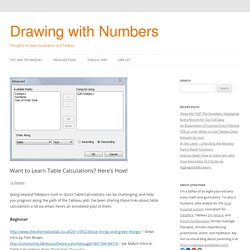
I’ve been sharing these links about table calculations a lot via email, here’s an annotated post of them: Beginner – Great intro by Tom Brown. – Joe Mako’s intro to Table Calculations from Think Data Thursday. – Tableau On-Demand training – Really basic – Another introduction, by Joe Mako. – Think Data Thursday talk on Setting up for Table Calculation Success by yours truly. – Rebuild the 10 workbooks on this page yourself and you’ll have a decent foundation. – A good introduction to what’s happening underneath the surface of table calculations. – RTM? Why not? This material is almost entirely covered by the above links, and at the same time learning table calculations is kind of like understanding the theory of relativity, or the narrative of Infinite Jest – continued study is rewarding.
Table Calculation Fundamentals.pdf. Version 6 table calcs - understanding a few basics. Joe, You can do a calculation between two table calcs using different addressing.
Here's how. Space: Calculation Reference Library. Is there a good training resource on... tables? Top 10 Tableau Table Calculations. This page shows 10 powerful examples of Tableau's Table Calculations.
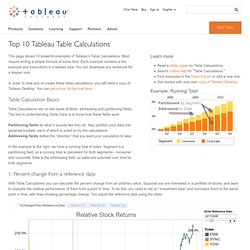
Most require writing a simple formula of some kind. Each example contains a live example and instructions in a tabbed view. You can download any workbook for a deeper look. Groundwork for Custom Table Calculations - InterWorks UK - Tableau Software & Business Intelligence Consulting. Custom Table Calculations is one of the most advanced concepts in Tableau.
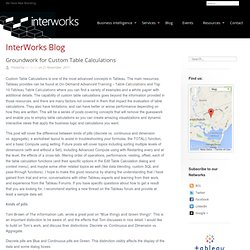
The main resources Tableau provides can be found at On-Demand Advanced Training – Table Calculations and Top 10 Tableau Table Calculations where you can find a variety of examples and a white paper with additional details. The capability of custom table calculations goes beyond the information provided in those resources, and there are many factors not covered in them that impact the evaluation of table calculations.
They also have limitations, and can have better or worse performance depending on how they are written. This will be a series of posts covering concepts that will remove the guesswork and enable you to employ table calculations so you can create amazing visualizations and dynamic interactive views that apply the business logic and calculations you want. Advanced Training - Table Calculations. Another Look at Site Catchment Analysis with Tableau 6 (Part 3) Question on how to create a product velocity ca... Here is my current working guess on an order of filter evaluation: 1.
Context Filters - temp table in data source, always evaluated first. Using Table Calculations. Use table calculations to further aggregate data on a cross-tab table. Table calculations look only at the data in the table, as the name suggests. A table calculation does not send another query to your database. Refer to the Top 10 Tableau Table Calculations page for examples of different table calculations you can use. The Quick Table Calculation option gives you some simple options like Running Total, Percent of Total, Percent Difference, and Moving Average that you can instantly add to the table.
Calculation type can be difference, percentage, running total, or moving calculation. Groundwork for Custom Table Calculations - InterWorks UK - Tableau Software & Business Intelligence Consulting. Top 10 Tableau Table Calculations. Blue things and Green things - The Information Lab. Why are some things in Tableau desktop BLUE and other things GREEN? Understanding the difference between the blue and green items in Tableau is (IMHO) the single most important piece of understanding necessary to make Tableau function well. It it so fundamental, that I can honestly say that until I understood this, I was pretty much guessing how Tableau would react to my actions.
What am I talking about? Take a look at the image below. Marked by the blue and green arrows, you can see a number of blue pills on various shelves (such as the row shelf and the colour shelf), and you can see a number of green pills elsewhere. You should also able to see that the icons in the data window are either blue or green. Doesn’t the blue/green colour indicate a measure or dimension? No. The colour is used to indicate which fields are discrete and which are continuous.
Blue fields are discrete and green fields are continuous. Table Calculation Functions. Defining Basic Table Calculations. When you add a Table Calculation to the view, you need to specify the parameters that define the formula used in the computation. All of these parameters are set in the Table Calculation dialog box. To manually define a table calculation: Right-click the measure you want to use in the computation and select Add Table Calculation.
In the Table Calculation dialog box, select one of the following types of calculations from the drop-down menu at the top: Differ ence From Calculation - compute the difference between two specified values. Secondary Table Calculations. Table calculations can be very useful when you want to perform a calculation that applies to all of the data in the table. Most of the time you will only need to add a single calculation such as Difference From or Running Total. However, you may sometimes want to combine two calculations so that you perform one and then perform the next on the results. For example, when calculating the Year to Date Growth, you first need to calculate the cumulative totals and then calculate the percent difference each total is from the previous year. Table Calculations. WINDOW_AVG(expression, [start, end])
Returns the average of the expression within the window. The window is dfined as offsets from the current row. Use FIRST()+n and LAST()-n for offsets from the first or last row in the partition. IF the start and end are omitted, the entire partition is used. For example, the view below shows quarterly sales. A window average within the Date partition returns the average sales across all dates. Example: WINDOW_AVG(SUM[Profit]), FIRST()+1, 0) = Average of SUM(Profit) from the second row to the current row.
Round Two:Think Data Thursday ideas. Hey Tracy welcome back! (How's the tan?)