
Top 50 Tableau Interview Questions And Answers For 2020. “The art and practice of visualizing data is becoming ever more important in bridging the human-computer gap to mediate analytical insight in a meaningful way.”
―Edd Dumbill In this Tableau interview questions blog, I have collected the most frequently asked questions by interviewers. These questions are collected after consulting with top industry experts in the field of Data analytics and visualization. TL;DR / 5 Categories of Tableau Deliverables - Tableau Magic. I have designed and delivered Tableau Solutions for a variety of clients, and while each client requirements differ, I generally fit them into 5 different categories; in this article, I will discuss the characteristics of each of the 5 categories, my main ideas and considerations.
To put it out there, a lot of solutions require different tools to handle these different categories, but it is a testament to Tableau that a single tool can be used for all 5 categories. 1. Presentation and Print Tableau can be deployed across various levels of the organisational hierarchy, and while analysts and developers will interact with and build dashboards using Tableau, when delivering to the executive level, more often than not, the output requested is not a URL or interactive dashboard but either a PDF or PowerPoint presentation. Note: I do see that times are changing, but we are not quite there yet.
My key considerations: 2. This is where the bulk of my Tableau Desktop work goes. 3. 4. 5. Summary. Percentile Distributions as a Dimension in Tableau. The Problem During a recent engagement a client asked a question I hear occasionally regarding Tableau which basically boiled down to: “How do I show marks for the percentile ranks of my customers by Sales?”
The client wanted to aggregate their measure, we’re using Superstore Sales here, up to the Customer level (Superstore stores information at a per item per order level so it’s an excellent proxy) then assign customers to 10th percentile buckets. Once assigned, the client wanted to do analysis on various relevant measures like Profit and Order Quantity (in this example). The main challenge with the ask is how the data is shaped. Much like Superstore we were faced with data that was aggregated at a lower granularity than how we intended to judge the customer worth. Fortunately with Tableau v9 we can achieve the desired result using the FIXED level of detail function! The Solution The first step we need to do was define Customer Worth as the lifetime total Sales from the Customer. Table Calculation Functions - Tableau. Version: 2020.2Applies to: Tableau Desktop, Tableau Online, Tableau Public, Tableau Server This article introduces table calculation functions and their uses in Tableau.
It also demonstrates how to create a table calculation using the calculation editor. Why use table calculation functions Table calculation functions allow you to perform computations on values in a table. For example, you can calculate the percent of total an individual sale is for the year, or for several years. Table calculation functions available in Tableau Returns the number of rows from the current row to the first row in the partition.
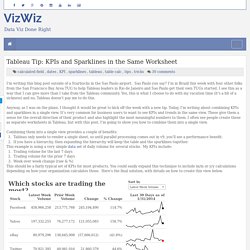
Tableau Conference 2019. Tableau Tip: KPIs and Sparklines in the Same Worksheet. I'm writing this blog post outside of a Starbucks in the Sao Paulo airport.
Sao Paulo you say? I'm in Brazil this week with four other folks from the San Francisco Bay Area TUG to help Tableau leaders in Rio de Janeiro and Sao Paulo get their own TUGs started. Top 10 Tableau Table Calculations. Tableau Training. The Tableau Desktop Starter Kit data visualization (above) was designed by Lari McEdward, Dusting Smith and Ellie Fields from Tableau Software digital team.
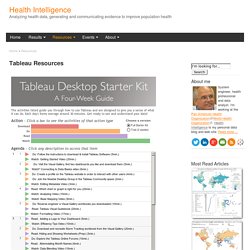
This viz was originaly featured in Tableau Public blog "20 Days to Tableau Success" Tableau Training and Tutorials - Online training and tutorial materials from Tableau. On-Demand Training section provides useful videos to improve Tableau use and skills. InterWorks Training Resource - A comprehensive collection of over 100 of the most requested links, blogs, tips and tricks the InterWorks team uses regularly, to help speed trainers in their way forward after a Tableau training course. Tableau Reference Guide - A collection of links to Tableau resources by Jeffrey Shaffer | Data + Science Product Help Tableau Software Product Help: Tableau help for both Desktop and Server products is available in many formats and languagesTableau Server online help: The 3-Minute Win - The 3-minute win is a simple concept: Start from scratch. The Power of Tableau Actions. How to create highly interactive Tableau dashboards using actions: a step-by-step tutorial and an example workbook Even if you are creating the most basic chart with Tableau Software, the visualization already includes a great set of interactive features without the need for using special functionality: clicking on a data point highlights this point and shades off all others.
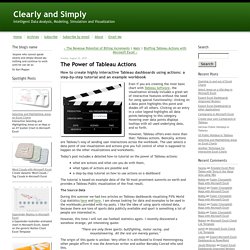
Clicking on an entry in a color legend highlights all data points belonging to this category. Hovering over data points displays tooltips with all used underlying data, and so forth. Thoughts on data visualization and Tableau. Menu Navigation within a Tableau Workbook - InterWorks UK Blog. There has been a conversation floating around on how to successfully navigate around different sheets of a workbook.
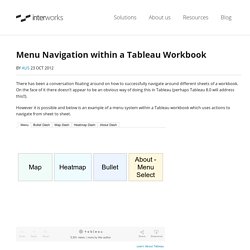
On the face of it there doesn’t appear to be an obvious way of doing this in Tableau (perhaps Tableau 8.0 will address this!!). However it is possible and below is an example of a menu system within a Tableau workbook which uses actions to navigate from sheet to sheet. It is definitely a useful trick to know about but is a little bit fiddly to set up. It is achieved by creating a series of sheets which will be used for navigation purposes. One will need to be created for each target dashboard plus an extra one for the return to main menu if you want. The text itself is created through a simple calculated field with the string written inside and dropped onto the label shelf.
Create a menu dashboard to drop all the link worksheets onto, format to taste and you’re ready to go. Tableau Zen. Alan Smithee Presents: Changing Viz Types with Dashboard Containers and Parameters. Alan Smithee Presents. What’s new in Tableau 9.0? Part 2 – Level of Detail Expressions « Bora Beran. Level of detail expressions extend Tableau’s calculation language by introducing the capability to define at what level aggregations should happen.

It is a small syntax change but implications are HUGE! I will focus on the technical details in this post with a few examples to clarify the concepts. Tableau 201: How to Make Bullet Graphs. Tableau. Top 15 LOD Expressions. Tableau’s mission is to help people see and understand data.
Our features are carefully designed to help people transform data into meaning. One area of focus is calculations. The easier it is to express ideas in a calculation language, the more meaning people can generate. The introduction of Level of Detail Expressions in Tableau 9.0 is a breakthrough in this regard. These new expressions let people express powerful concepts using simple statements. Level of Detail Expressions provide a way to easily compute aggregations that are not at the level of detail of the visualization. Each of the following 15 workbooks contains customized data sources and can be downloaded for further details. 1. Finding the number of orders each customer has made is relatively easy, but what if we wanted to know the number of customers who made one order, two orders, three orders, and so forth?
Consider the sales database of a superstore that has multiple items per order. 2. 3. 4. 5. 6. 7.