
How to count distinct users on a running period. Richard's workbook shows a couple of issues related to how padding works in Tableau.

First, a couple quick notes. There are three sources of added values: ‘Show Missing Values’ for ‘line and area charts’, ‘Show Missing Values’ for table calcs, and table calc densification (think of this as filling in missing values in a text table). These three can interact in different ways. Let’s call these axis domain padding, table calc domain padding and table calc domain completion respectively. The first thing I’ll note is that of the first four examples, only the ‘Padding (discrete)’ sheet is doing axis domain padding. It seems like the first four examples are basically behaving as expected. The last two sheets have two dimensions, while the previous four only have a single dimension.
In ‘Attempt at padding and and completion (continuous)’, there's a dimension on LOD. I thought the ‘Cell’ ordering may have been unintentional so i explored alternatives. . :)ross.
RHSD - Master Tableau Approach. In an earlier post, titled Master Tableau Concepts, I have summarized and added color to a talk by Joe Mako in which he highlighted the advanced concepts that a master practitioner can use to achieve flow by working with instead of against Tableau.

This was an excellent talk which he also gave as a repeat at TC14. In this new post, Master Tableau Approach, I’ll summarize & add color to a TC14 session from Bethany Lyons and Alan Eldridge, titled Jedi Level Calculation Techniques. Today's topic is the thought process used by a master practitioner when deciding which technique to employ when answering a complex question using Tableau. While introducing his own TC14 session, Dashboarding at the Edge of Impossible, Dustin Smith described the Tableau Jedi not as the person who knows every tip and trick. He instead described a Jedi as the person who knows how to best approach the problem. So a common aim of 4 separate Jedi level sessions at TC14 was to teach not tactic, but strategy. Null. Transition Matrix. I'm with Noah.

Doing the work outside of Tableau to give yourself a Row ID that you could join on or even to set up some slightly-complicated SQL to do the same using a date will make life so much easier in Tableau that I believe it's worth the effort. I'll explain how the LOOKUP() is doing what it does in your Table Calc view, then explain why a working table calc solution is more difficult to put together.
Tableau makes working at different levels of granularity really easy, right up until the point that we need to pay attention to them and then it's not much help. In the Table Calc view, there are two levels of granularity that are important, the granularity of the raw data (where Date & Name are the dimensions that determine what makes a unique record) and the granularity of the view (the distinct combinations of values of the dimension(s) are on Rows, Columns, Pages, and the Marks Card).
The Table Calc view has only Current Bucket as a dimension. Jonathan. What I Learned About Tableau Join Culling Over Summer Vacation. Tableau + PhpGrid = an (almost) instant gratification data entry tool. Impatient?

Skip down to the bottom for a brief screencast demonstration. We, over here at Linium, love Tableau Server. Big time. It takes quite the tool to be able to wrap around all my procedural data hacking and make it look like it came that way. The Cross Join Collection. Introduction Because it is a powerful tool to dynamically reshape and create data which otherwise is "too hard" to do.
My hope is that various helpers can use these techniques when helping others and themselves. DOES NOT = Hi Ben, You wrote: This works at comparing 3 Excel docs, by seeing if there are any matching fields in Series Title column and then applying on of the 3 status.
However this only works if there IS the series title in the main doc and one of the OP docs. if the series title is not in the main doc and in on of the OP docs then it just ignores it This is exactly how data blending works in Tableau. The dimensions from the primary data source set the granularity (level of detail) of the view (by view I mean Rows, Columns, Pages, and Marks Card).
Dimensions and Measures. More on Blue & Green pills Tableau automatically classifies your data based on whether it contains categorical data (dimensions) or quantitative data (measures).

In general, dimensions create headers when placed in the view while measures create axes. Blue fields = discrete (create headers)Green fields = continuous (create axes)Bold fields = sortedFields with no () are Discrete (often a dimension, not necessarily)Fields with AGG() or something else are aggregatedATTR() runs something like “if MIN(var) = MAX(var) then return var”, so it’s often the maximum value. Discrete field always add headers to the view while continuous fields add axes to the view.
Tableau. When hearing about governmental politics, we encounter a lot of information, some official – some from different observers and commentators.

We frequently hear about internal turmoil or even crises in the government, and from time to time we see a minister leaving or switching office for one reason or another. Such changes are, of course, recorded in official annals and publications – but rarely do we take the time to actually put a visual face and pattern on this data. If we could do that, it might prompt us to ask other – perhaps more interesting – questions – and hopefully, get interesting answers. Schema.ini File (Text File Driver) When the Text driver is used, the format of the text file is determined by using a schema information file.
The schema information file is always named Schema.ini and always kept in the same directory as the text data source. The schema information file provides the IISAM with information about the general format of the file, the column name and data type information, and several other data characteristics. Understanding Data Types and Roles. Data types and roles are fundamental components that contribute to how Tableau categorizes your data.
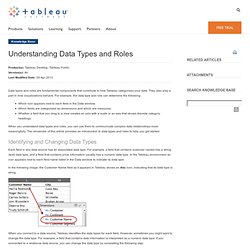
They also play a part in how visualizations behave. For example, the data type and role can determine the following: Which icon appears next to each field in the Data window. Which fields are categorized as dimensions and which are measures. Extract API Introduction. Building Tableau Data Extract files with Python in Tableau 8 - Sample Usage - Ryan Robitaille. See also : Tableau Data Extracts from SQL Server or from CSV files If you were learning (and / or partying) with us at the Tableau Customer Conference 2012 in Beautiful San Diego (where me and 6 other individuals were also crowned 'Tableau Zen Masters' , ahem) - then you've probably been playing around with the Tableau 8 Beta over the past few weeks. Tableau 8 brings a whole load of new features and performance improvements , but it also includes 2 new APIs for us tinkering / hack-y peeps. Get the Data Extract API. Build Tableau Data Extracts out of CSV Files? More Python TDE API madness! - Ryan Robitaille.
# ryan robitialle (12/6/2012) # creating Tableau Data Extracts via CSV files import csv , os , time from datetime import datetime import dataextract as tde #saves some typing, cause i'm a lazy fucker ################ PARAMETERS FOR YOU, CODE MONKEY! ########################## cvsfilenamemask = 's.csv' # can be explicit 'thisfile.csv' for one file - or open '.csv' for all that match sourcedir = 'C: \\ Python27 \\ ' # need to double up the \\s | windows shares use like this '\\\\ryrobesxps\d$\' etc targetdir = 'C: \\ Python27 \\ ' # can't be a share or UNC path csvdelimiter = ',' # obvious! Resolving Incorrect Data Type Issues. To resolve issues related to misinterpreted data types, you can complete one of the following procedures. Each is described in more detail in its own section below. Create a schema information file that explicitly declares the data type of each column in a CSV- or tab-delimited text file.
This is the most reliable method, but it requires that the data source is put into a text format, and it takes a bit of work to set up initially. Modify the data source to force Jet to interpret the correct data type. This is straightforward to do and reliable for forcing numeric values to be interpreted as text.