
Tableau Support Community. There was something I forgot about, and that is that a pill sort on a combined field is ignored by table calcs using Automatic sort.
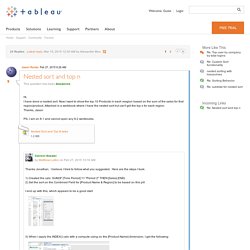
There is a way around this, but there are two easier ways: 1) use a BYO combined field then play with the advanced compute using. For this, I built a combined string, then set up the sort on that just like the original, then added an Advanced Compute Using to get around the fact that a Tableau combined field lets us independently address on parts of the combined field: 2) Just use an Index with an advanced Compute Using & custom Sort. The Cross Join Collection. Introduction Because it is a powerful tool to dynamically reshape and create data which otherwise is "too hard" to do.
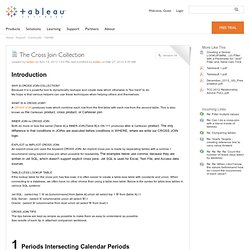
My hope is that various helpers can use these techniques when helping others and themselves. INNER JOIN vs CROSS JOIN Both do more or less the same! [Table A] a INNER JOIN [Table B] b ON 1=1 produces also a Cartesian product. EXPLICIT vs IMPLICIT CROSS JOIN An explicit cross join uses the keyword CROSS JOIN. If the lookup table for the cross join has few rows, it is often easier to create a table-less table with constants and union. Jet SQL: (select top 1 'A' as [columnname] from [table A] union all select top 1 'B' from [table A] ) t SQL Server: (select 'A' columnname union all select 'B') t Oracle: (select 'A' columnname from dual union all select 'B' from dual) t The tips below are kept as simple as possible to make them as easy to understand as possible.
See results of each tip in attached companion workbook. 1 Periods Intersecting Calendar Periods Query See also SELECT d. Using a filter on one dashboard takes me to ano. Brilliant!
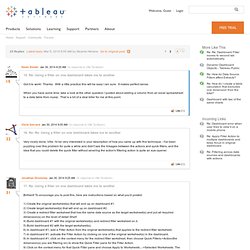
To encourage you to post this, here are instructions based on what you'd posted: 1) Create the original worksheet(s) that will end up on dashboard #1. 2) Create target worksheet(s) that will end up on dashboard #2. Comparing Each Against Each Other: The No-SQL Cross Product. Here’s a problem that has been bouncing around in my brain since I first used Tableau.
How do I compare the results of every permutation of one item vs. another? Here’s an example using Superstore Sales – I put Region on Rows and Columns, and SUM(Sales) on the Text Shelf, and only see four values: What if I want to compare Sales in Central to those in East, South, and West, and Sales in East to South and West, and Sales in West to Sales in South simultaneously? We can compare two at a time using parameters or a self-blend, or one vs. the rest in different ways via sets or table calcs or calculated fields, but how about each against each other? What if we want a correlation matrix?
When we put Region on both Rows and Columns, even though we have 4 rows by 4 columns = 16 cells, Tableau generates only 4 marks, because there are only 4 Regions in the data. Tricks + Miscellaneous Techniques. These are either single tips or chunks of techniques that don’t have their own page yet.
Be sure to check out the following sources of material on the Tableau Community: Get last value in dataset Fixing axis size Use an invisible reference line, either based on a constant or a calculated field. Tableau will make sure the axis range is big enough. Show the same day last year in a Get max value of [Date] no matter sort order: attr([Date])=window_max(attr([Date])) How do I move the location of the "Grand Total"... Moving Headers from Bottom to Top. With a single discrete field on the Columns shelf, your headers will be placed on the bottom of the visual by default.
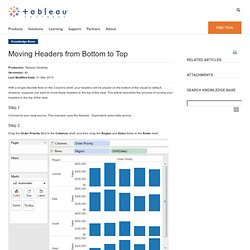
However, suppose you want to move these headers to the top of the view. This article describes the process of moving your headers to the top of the view. Step 1 Connect to your data source. This example uses the Sample - Superstore sales data source. Step 2. Combining Bar Graphs and KPI's on one worksheet.
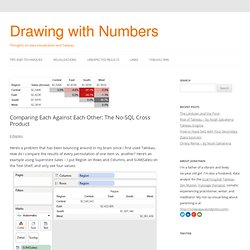
How to display only 1 axis label on a dual axis... I have a list of events with start and end dates.
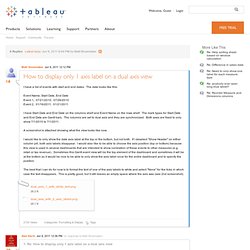
The data looks like this: Event Name, Start Date, End Date Event 1, 07/21/2010, 07/26/2010 Event 2, 01/16/2011, 01/21/2011 I have Start Date and End Date on the columns shelf and Event Name on the rows shelf. A screenshot is attached showing what the view looks like now. I would like to only show the date axis label at the top or the bottom, but not both. The best that I can do for now is to format the text of one of the axis labels to white and select "None" for the ticks in which case the text disappears.