
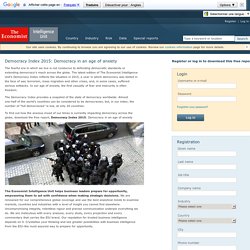
The Bertelsmann Stiftung’s Transformation Index, BTI. EIU Democracy Index. The fearful era in which we live is not conducive to defending democratic standards or extending democracy's reach across the globe.
FH Freedom in the World. FH Nations in Transit. The Atlas of Economic Complexity. CATO Economic Freedom of the World. Global economic freedom increased slightly in this year’s report, but remains below its peak level of 6.92 in 2007.
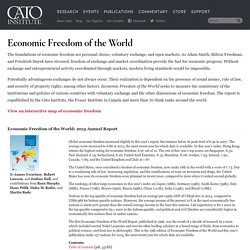
The average score increased to 6.86 in 2013, the most recent year for which data is available. In this year’s index, Hong Kong retains the highest rating for economic freedom, 8.97 out of 10. The rest of this year’s top scores are Singapore, 8.52; New Zealand, 8.19; Switzerland, 8.16; United Arab Emirates, 8.15; Mauritius, 8.08; Jordan, 7.93; Ireland, 7.90; Canada, 7.89; and the United Kingdom and Chile at 7.87. HF Index of Economic Freedom.
IMD World Competitiveness Yearbook. SWFI Linaburg-Maduell Transparency Index. The Linaburg-Maduell Transparency Index was developed at the Sovereign Wealth Fund Institute by Carl Linaburg and Michael Maduell.
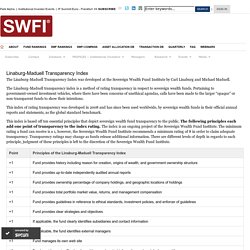
The Linaburg-Maduell transparency index is a method of rating transparency in respect to sovereign wealth funds. Pertaining to government-owned investment vehicles, where there have been concerns of unethical agendas, calls have been made to the larger “opaque” or non-transparent funds to show their intentions. This index of rating transparency was developed in 2008 and has since been used worldwide, by sovereign wealth funds in their official annual reports and statements, as the global standard benchmark.
This index is based off ten essential principles that depict sovereign wealth fund transparency to the public. WB Doing Business. Economy Rankings Economies are ranked on their ease of doing business, from 1–190.
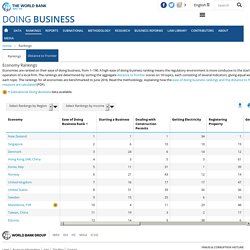
A high ease of doing business ranking means the regulatory environment is more conducive to the starting and operation of a local firm. The rankings are determined by sorting the aggregate distance to frontier scores on 10 topics, each consisting of several indicators, giving equal weight to each topic. The rankings for all economies are benchmarked to June 2016.
WB Indicators from Agriculture to Urban Development. This page in: Indicators Agriculture & Rural Development Aid Effectiveness Climate Change Climate Change Knowledge Portal.
WB International Debt Statistics. Focuses on financial flows, trends in external debt, and other major financial indicators for developing and advanced economies (data from Quarterly External Debt Statistics and Quarterly Public Sector Debt databases).
Includes over 200 time series indicators from 1970 to 2014, for most reporting countries, and pipeline data for scheduled debt service payments on existing commitments to 2022. Access the database, tables and content of the new IDS Database Archives These archives contain Excel spreadsheets and range in size from 6-80Mb (compressed), and include databases from the period prior to 2012 when the report was named Global Development Finance.
WB Knowledge Economy Index. 109 structural and qualitative variables for 146 countries to measure their performance on four Knowledge Economy pillars: Economic Incentive and Institutional Regime, Education, Innovation, and Information and Communications Technologies.
WB Logistics Performance Index. WB World Development Indicators. IMF World Economic Outlook Database List. The World Economic Outlook (WEO) database is created during the biannual WEO exercise, which begins in January and June of each year and results in the April and September/October WEO publication.
Selected series from the publication are available in a database format. See also, the World Economic Outlook Reports. August 29, 2016 World Economic Outlook Database April 2016. WEF Reports.
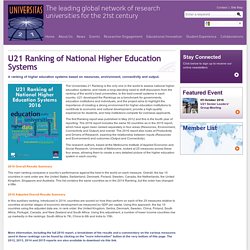
UNDP Education index. U21 Ranking of National Higher Education Systems. A ranking of higher education systems based on resources, environment, connectivity and output.
Pearson The Learning Curve. PISA, Programme for International Student Assessment. This years focus is mathematics with an additional test in creative thinking.

The new PISA 2021 mathematics framework was recently launched. Preparations for this test are underway with participants from 36 OECD members and likely 50+ non-members involved. The PISA 2024 innovative domain, Learning in the Digital World, aims to measure students’ ability to engage in self-regulated learning while using digital tools. The tasks measure students’ capacity to monitor their progress, use feedback and stay engaged while they build models and develop solutions with digital tools. These skillsets are essential in preparing students to learn autonomously in an increasingly complex and digital world. Want to join PISA? TIMSS and PIRLS. WorldSkills. ILO World Employment and Social Outlook. ILO Global Employment Trends for Youth. The International Energy Efficiency Scorecard. The 2012 International Energy Efficiency Scorecard ranks 12 of the world's largest economies, representing over 78 percent of global gross domestic product, 63 percent of global energy consumption, and 62 percent of the global carbon-dioxide-equivalent emissions.
The rankings include: Australia, Brazil, Canada, China, France, Germany, Italy, Japan, Russia, the United Kingdom, the United States, and the European Union. Over 25 different energy efficiency indicators or "metrics" have been analyzed for each economy ranked in the report. The rankings are determined by a total score out of 100 possible points. Points can be earned in four difference categories including buildings, industry, and transportation, as well as metrics that track cross-cutting aspects of energy use at the national level. The 2014 International Energy Efficiency Scorecard will be released in the summer of 2014 with more countries and more metrics.
Can’t wait for the 2014 International Scorecard? Renewables Global Status Report. EIU Global Food Security Index. A.T. Kearney Global Cities. The A.T. Kearney Global Cities Index (GCI) ranks 125 cities according to 27 metrics across five dimensions, including business activity, human capital, information exchange, cultural experience, and political engagement. The Global Cities Outlook (GCO) examines 125 cities and ranks 13 leading indicators across four dimensions: personal well-being, economics, innovation, and governance. The rank and score in the GCO is determined by measuring change across each metric in the past five years, then projecting out to 2024.
It measures the likelihood that a city will improve its global standing over the next 10 to 20 years. Together they create an unmatched perspective into global cities by: Providing a view of current performance and future potential Identifying historical trends since 2008 Analyzing the performance of 125 cities representing all regions Measuring a holistic set of metrics and indicators at a city level.
KOF Index of Globalization. WHO Global Health Observatory data. Global Strategy for Women's, Children's and Adolescents' Health (2016-2030): Data portal The Every Woman Every Child Global Strategy indicator and monitoring framework includes 60 indicators from health and other sectors. 34 indicators are from the Sustainable Development Goals (SDGs) and 26 from related global monitoring initiatives.
From these, 16 key indicators are highlighted to provide a snapshot of progress. WHO Life expectancy. WHO World Health Statistics. Happy Planet Index. UNDP Human Development Index, HDI. The HDI was created to emphasize that people and their capabilities should be the ultimate criteria for assessing the development of a country, not economic growth alone.
The HDI can also be used to question national policy choices, asking how two countries with the same level of GNI per capita can end up with different human development outcomes. These contrasts can stimulate debate about government policy priorities. UNDP Gender Inequality Index, GII. Gender inequality remains a major barrier to human development. Girls and women have made major strides since 1990, but they have not yet gained gender equity.
The disadvantages facing women and girls are a major source of inequality. ITU Global ICT Development Index. Select an option Share: Print: Save: FH Freedom on the Net. FreePartly FreeNot Free. Global Innovation Index. Digital Diplomacy Index. BICC Global Militarization Index, GMI. SIPRI Yearbook Online: Armaments, Disarmament and International Security. World Nuclear Industry Status Report. Power Reactor Information System, PRIS. Global Open Data Index. IEP Global Peace Index, GPI. Through See the latest peace news and research Contact us. World Giving Index. UNDP Multidimensional Poverty Index, MPI. Like development, poverty is multidimensional — but this is traditionally ignored by headline money metric measures of poverty. Social Progress Index. World Press Freedom Index.
FH Freedom of the Press. By Jennifer Dunham. International Property Rights Index, IPRI. OECD Better Life Index. EIU Global Liveability Ranking. The latest findings of The Economist Intelligence Unit's Global Liveability Ranking – which provides scores for lifestyle challenges in 140 cities worldwide – show that although Melbourne has retained its crown as the world's most liveable city, liveability has deteriorated in 29 of the 140 cities (20 per cent) surveyed over the last 12 months. Global AgeWatch Index. Top Get involved. Mercer Quality of Living Rankings. UBS Global Real Estate Bubble Index. Global Slavery Index. ILO World Social Protection Report. Rule of Law Index. The World Justice Project (WJP) Rule of Law Index® is the world’s leading source for original data on the rule of law.
WB Worldwide Governance Indicators. TI Corruption Perceptions Index, CPI. Fragile States Index. World Wealth Report. CSIS The Global Youth Wellbeing Index. Prosperity Index. National success is about more than just wealth. And yet, traditionally we have used narrow measures of wealth (such as GDP) as our benchmark to determine the success of nations.