
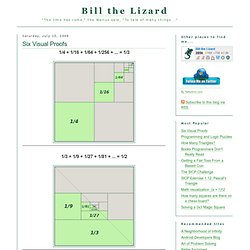
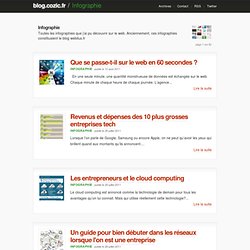
The Gamification of Education Infographic #gamification #edtech. Bill the Lizard: Six Visual Proofs. 1 + 2 + 3 + ... + n = n * (n+1) / 2 1 + 3 + 5 + ... + (2n − 1) = n2 Related posts:Math visualization: (x + 1)2 Further reading:Proof without Words: Exercises in Visual ThinkingQ.E.D.: Beauty in Mathematical Proof Also, my thanks go out to fellow redditor cnk for improvements made to the 1/3 + 1/9 + 1/27 + 1/81 + ... = 1/2 graphic.
50 Great Examples of Data Visualization. Wrapping your brain around data online can be challenging, especially when dealing with huge volumes of information.

And trying to find related content can also be difficult, depending on what data you’re looking for. But data visualizations can make all of that much easier, allowing you to see the concepts that you’re learning about in a more interesting, and often more useful manner. Below are 50 of the best data visualizations and tools for creating your own visualizations out there, covering everything from Digg activity to network connectivity to what’s currently happening on Twitter. Music, Movies and Other Media Narratives 2.0 visualizes music. Liveplasma is a music and movie visualization app that aims to help you discover other musicians or movies you might enjoy. Tuneglue is another music visualization service. MusicMap is similar to TuneGlue in its interface, but seems slightly more intuitive. Digg, Twitter, Delicious, and Flickr. 2012 March 12 - The Scale of the Universe 2. Discover the cosmos!

Each day a different image or photograph of our fascinating universe is featured, along with a brief explanation written by a professional astronomer. 2012 March 12 The Scale of the Universe - Interactive Flash Animation Credit & Copyright: Cary & Michael Huang Explanation: What does the universe look like on small scales?
On large scales? Tomorrow's picture: dust before galaxies Authors & editors: Robert Nemiroff (MTU) & Jerry Bonnell (UMCP)NASA Official: Phillip Newman Specific rights apply.NASA Web Privacy Policy and Important NoticesA service of:ASD at NASA / GSFC& Michigan Tech. Envisioning emerging technology for 2012 and beyond (by Michell Zappa) Ideas, issues, knowledge, data - visualized! Chart Porn. Spaceships drawn to scale. Plus de 700 infographies sur webilus.fr !
En une seule minute, une quantité monstrueuse de données est échangée sur le web.
Chaque minute de chaque heure de chaque journée. L’agence... Lorsque l’on parle de Google, Samsung ou encore Apple, on ne peut qu’avoir les yeux qui brillent quand aux montants qu’ils annoncent.... Le cloud computing est annoncé comme la technologie de demain pour tous les avantages qu’on lui connait. Mais qui utilise réellement cette technologie?... Vous êtes une entreprise et vous souhaitez vous lancer comme vos amis dans les réseaux sociaux. Les réseaux sociaux sont addictifs et personne ne peut dire le contraire. Nous lisons de plus en plus et notamment en ligne. Foursquare est sans contest le réseau social de géolocalisation, leader sur son marché. Collection: Visual thinking.
Visual Thinking Archive. Visual dictionary. Shahi - A visual dictionary.