
Xenographics – Weird but (sometimes) useful charts. The Chartmaker Directory. Gallery of Concept Visualization. VisuAlgo - visualising data structures and algorithms through animation. Multivis.net - Visualization and Visual Analysis of Multifaceted Scientific Data. Visualizing Sets and Set-typed Data visualization catalog. Software Tools, Demos, Videos, and Conference Slides Companion website for our survey on set visualization, published in Computer Graphics Forum ( pdf).
A graphical list of set-related tasks is available here. A printable and more comprehensive list of the resources is available in PDF as supplementary material of the survey. NEW: The slides of our EuroVis 2014 talk are available here (in Powerpoint format). New: a publication browser of the surveyed techniques is available here. New: another publication browser of the surveyed techniques is available here (by Adil Yalçın). Note: we appreciate if you refer us to related material and techniques for set visualization that we missed, also we welcome your feedback or proposals to our work (contact Bilal Alsallakh or Luana Micallef) Venn and Euler Diagrams eulerAPE eulerGlyphs eulerForce 3-Circle Venn Diagram Applet Wilkinson’s venneuler() d3venn: Venn Diagrams with D3.js Venn Diagrams with Processing.js EulerView Variants of Euler Diagrams Fan Diagrams DiTop.
SentimentVis Browser. Text Visualization Browser. Treevis.net. The Finance Vis Browser. Spacetimecubevis.com. Performance Visualization. Dynamic Graph Visualization. List of Physical Visualizations. Mobile Infovis and Dataviz Pattern. MobileVis. Vis4me - Personal data visualisation.
Visualizing Cities. Timelines Revisited: Gallery. Simple techniques for bridging the graphics language gap. Idav.ucdavis. Vizipedia. Atlas. WTF Visualizations. Improving datavis for the public sector. "Spike" map Interactive United States population density map.
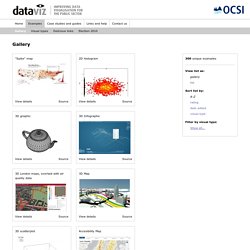
Average rating: 7.6 (31 votes) 2D histogram An extension of the concept of histogram to display the colour image content. Average rating: 4.3 (6 votes) 3D graphic An example of a 3D visualisation, used in this case to represent an object. Average rating: 2.2 (11 votes) 3D Infographic This is an online application that presents backdated meteorological data from Augsburg, Germany. Average rating: 6.4 (11 votes) 3D Map 3D-rendered map of London showing landmarks and accurate locations of tube lines. Average rating: 6.5 (13 votes) 3D scatterplot Extension of a scatterplot to third dimension to represent measurements on sepals and petals of Iris flowers.
Average rating: 3 (3 votes) Accesibility Map The map shows the average number of pickups for different times of the day and days of week. The Data Visualisation Catalogue. Data Visualization. News Graphics Collection. Junk Charts. This post is part 2 of an appreciation of the chart project by Google Newslab, advised by Alberto Cairo, on the gender and racial diversity of the newsroom.

Part 1 can be read here. In the previous discussion, I left out the following scatter bubble plot. This plot is available in two versions, one for gender and one for race. The key question being asked is whether the leadership in the newsroom is more or less diverse than the rest of the staff. The story appears to be a happy one: in many newsrooms, the leadership roughly reflects the staff in terms of gender distribution (even though both parts of the whole compare disfavorably to the gender ratio in the neighborhoods, as we saw in the previous post.) Unfortunately, there are a few execution problems with this scatter plot. First, take a look at the vertical axis labels on the right side. I find this decision confounding.
The horizontal axis? Here is the same chart with improved axis labels: Re-labeling serves up a new issue. Information aesthetics - Data Visualization & Information Design. Visualizing the city built of data. Urban Data visualizations of the city, making the city smarter with data. A visual exploration on mapping complex networks. TimeViz Browser. Imrich, P.; Mueller, K.; Imre, D.; Zelenyuk, D.
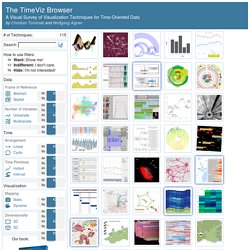
& Zhu, W.: Interactive Poster: 3D ThemeRiver. Poster Compendium of IEEE Symposium on Information Visualization (InfoVis), IEEE Computer Society, 2003. Imrich, P.; Mueller, K.; Imre, D.; Zelenyuk, D. & Zhu, W. (2003), © 2003 IEEE. Used with permission. Image courtesy of Ben Fry, MIT Media Laboratory, Aesthetics + Computation Group, © 1999-2005.