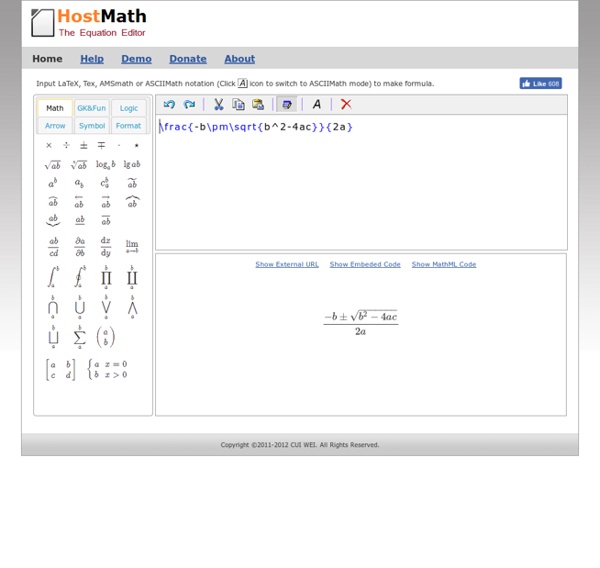


Online Latex Equation Editor Convert Latex Equations into Images to Embed in DocumentsEmbed Equation in Web Page, Forum, Google Docs, TwitterRender Latex Math Equations into Plain Text ASCIIInsert ASCII Eqn as comment in source-code or emailConvert your email or address to image to avoid spamSupports (PNG, GIF, JPG, TIF, BMP, PNM, FIG, PS)Control Equation Font Family, Size, Color, and OpacityUnlimited Uploads, No Registration Learn Latex QuickySymbolsBook 1Book 2Book 3 | You need not to enter Latex math tags such as $...$, \begin{equation}...\end{equation}, or \begin{eqnarray}...\end{eqnarray} ➘ More Productivity Tools i2Clipart Royalty Free Public Domain Clipart suitable for academic presentations and project logos i2Symbol Personalize social messages, e-mails, and tweets with rich graphical symbols i2OCR Convert scanned documents, faxes, or screenshots into editable text in 33+ languages iPdf2Split Split long PDF file i.e., dissertation, books into smaller PDF files i.e., chapters and proofs iPdf2Merge i2PDF iWeb2Shot i2Speak
Configurer TeXnicCenter | Le blog de Seb TeXnicCenter fait partie des meilleurs éditeurs dédiés à la création de documents LaTeX sous Windows. Sa configuration est plutôt simple. Il est préférable de commencer par installer les logiciels suivants: Adobe Reader ou Foxit pour la lecture de fichiers PDF.MiKTeX pour la génération de documents LaTeX.Ghostscript et GSview pour la gestion de document PS (PostScript). L’éditeur TeXnicCenter peut enfin être installé. Il faut ensuite établir des connections avec les programmes ci-dessus. Le chemin du dossier qui contient les exécutables : tex, latex etc… se trouve dans le répertoire des exécutables de Miktek: C:\Program Files\MiKTeX 2.7\miktex\bin Si vous souhaitez travailler en mode de compilation PDF et utiliser le package epstopdf, vous pouvez dès à présent définir les options de compilation pour LaTeX => PDF en ajoutant "-shell-escape" comme dans l’exemple ci-dessous: C:\Program Files\MiKTeX 2.7\miktex\bin\pdflatex.exe -shell-escape C:\Program Files\TeXnicCenter\Language Like this:
t1 | dbdsgnr Schema New Load Save(first login) Properties Insert TableAlt+T NoteAlt+N View Sort Collapse Line type Bezier Cornered Share Permalink Export SqlAlt+S Image Help Feedback About Try the new Beta Version Loading.......
Pygame 3D Graphics Tutorial Our wireframe object is currently defined by a list of Node objects and a list of Edge objects, which hopefully makes things easy to understand, but it isn't very efficient. That's not a problem if we're just making cubes, but will be if we want to create more complex objects. In this tutorial, we will: Convert our list of nodes to a numpy arraySimplify how edges are storedCreate a cube using the new system By the end of this and the following tutorial our program should function exactly the same as before, but will be more efficient. NumPy If you're not familiar with NumPy, then this tutorial might take a bit of work to understand, but I think it's worth the effort. The first thing is to download NumPy if you haven't already done so. import numpy as np Since NumPy includes a lot of mathematical functions, we can use it to replace the math module, thus replace math.sin() with np.sin(). NumPy arrays (matrices) self.nodes = np.zeros((0, 4)) This creates a NumPy array with 0 row and 4 columns.
Using the rJava package on Win7 64 bit with R Free Online Introduction to LaTeX - Part 1: The Basics - Overleaf Welcome to the first part of our free online course to help you learn LaTeX. If you have never used LaTeX before, or if it has been a while and you would like a refresher, this is the place to start. This course will get you writing LaTeX right away with interactive exercises that can be completed online, so you don't have to download and install LaTeX on your own computer. In this part of the course, we'll take you through the basics of how LaTeX works, explain how to get started, and go through lots of examples. Setting up a LaTeX Document Typesetting Text Handling LaTeX Errors Typesetting Equations Using LaTeX Packages In part two and part three, we'll build up to writing beautiful structured documents with figures, tables and automatic bibliographies, and then show you how to apply the same skills to make professional presentations with beamer and advanced drawings with TikZ.
Introduction à LaTeX, partie 1 (mise à jour) Introduction à LaTeX, partie 1 (mise à jour) Il y a quatre ans et demi environ, à l’époque de cuk.ch version 1 (les fidèles de longue date écraseront une larme de nostalgie), Fabien Conus a rédigé et publié sur ce site une remarquable série d’articles sur LaTeX, qui a permis à bien des gens de s’initier à ce formidable « formateur de texte ». Ces cours sont bien sûr toujours accessibles aux liens suivants : Introduction à LaTeX, partie 1Partie 2Partie 3Partie 4Partie 5Partie 6 Malheureusement, les exemples de code LaTeX de ces cours ont très mal supporté le passage de cuk.ch à la version actuelle (disparition de certains signes comme la très importante contre-oblique « \ », apparition d’espaces et sauts de ligne intempestifs…), si bien qu’il est préférable maintenant de se référer à la version PDF complète de ce cours. Laissons donc maintenant la parole à Fabien, et bonne (re)lecture ! Kézako ? En 1978, Donald E.
Edit Pad - Online Text Editor Invitation to World Literature Greek, by Euripides, first performed in 405 BCE The passionate loves and longings, hopes and fears of every culture live on forever in their stories. Here is your invitation to literature from around the world and across time. Sumerian, 2600 BCE and older Turkish, by Orhan Pamuk, 2000 Greek, by Homer, ca. eighth century BCE Greek, by Euripides, first performed in 405 BCE Sanskrit, first century CE Japanese, by Murasaki Shikibu, ca. 1014 Chinese, by Wu Ch'êng-ên, ca. 1580 Quiché-Mayan, written in the Roman alphabet ca. 1550s French, by Voltaire, 1759 English, by Chinua Achebe, 1959 Spanish, by Gabriel García Márquez, 1967 English, by Arundhati Roy, 1998 Arabic, first collected ca. fourteenth century
r - Importing specific cells from excel spreadsheet