
Mode. Best books for survival analysis in R : rstats. How To Create A Perfect Resume Examples 2017 Make Best Samples Of Resumes With R ~ Sevte. Method Matters: Sentiment Use Across the Course of Pitchfork Music Reviews: A Tidy Text Analysis with R. In this post, we'll return to the Kaggle data containing information on Pitchfork music reviews.
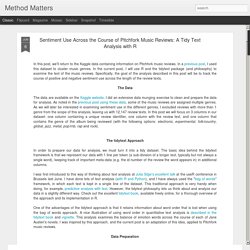
In a previous post, I used this dataset to cluster music genres. In the current post, I will use R and the tidytext package (and philosophy) to examine the text of the music reviews. Specifically, the goal of the analysis described in this post will be to track the course of positive and negative sentiment use across the length of the review texts. The Data The data are available on the Kaggle website. The tidytext Approach In order to prepare our data for analysis, we must turn it into a tidy dataset. I was first introduced to this way of thinking about text analysis at Julia Silge's excellent talk at the useR conference in Brussels last June. One of the advantages of the tidytext approach is that it retains information about word order that is lost when using the bag of words approach. What Are We Plotting, What Are We Animating. The Chartmaker Directory. តោះៗៗៗ សម្រាប់អ្នកចង់ចេះ Excel អាចមករៀននៅទីនេះបាន ងាយស្រួលយល់ខ្លាំងណាស់ (មានវីដេអូ) – Amapapa Me.
សម្រាប់ការងារនៅក្នុងការិយាល័យភាគច្រើន អ្នកមិនអាចជៀសផុសនៅក្នុងការប្រើប្រាស់កម្មវិធី Microsoft Excel បាននោះឡើយ ព្រោះថាវាជាចំណេះដឹងកុំព្យូទ័រចាំបាច់ដែលអ្នកទាំងអស់គ្នាត្រូវតែចេះ ដើម្បីពន្លឿនការងារ និងប្រសិទ្ធិភាពការងារមានគុណភាពខ្ពស់ផងដែរ។ តួយ៉ាងនៅក្នុងវីដេអូឃ្លីបមួយនេះវិញ យើងសង្កេតឃើញមានការបង្ហាត់បង្ហាញនូវគន្លឹះ និងរូបមន្តមួយចំនួនដែលពិតជាមានប្រយោជន៏ក្នុងការងាររបស់ប្រចាំថ្ងៃរបស់យើងតែម្តង ហេតុដូច្នេះហើយ វាមិនខាតពេលប៉ុន្មាននោះទេ នៅក្នុងការតាមដានរៀនវីដេអូមួយនេះ។ ដូចអ្នកទាំងអស់គ្នាអាចឃើញ គ្រាន់តែប្រើប្រាស់រូបមន្ត និងអូសតែបន្តិច កម្មវិធី Microsoft Excel អាចធ្វើការបូកលេខអោយអ្នកបានយ៉ាងលឿន និងត្រឹមត្រូវថែមទៀតផង។
How to Use R With Excel. Python - Failed building wheel for rpy2. Datasets - RDataMining.com: R and Data Mining. Association Mining With R. Association mining is commonly used to make product recommendations by identifying products that are frequently bought together.

But, if you are not careful, the rules can give misleading results in certain cases. Association mining is usually done on transactions data from a retail market or from an online e-commerce store. Since most transactions data is large, the apriori algorithm makes it easier to find these patterns or rules quickly. So, What is a rule? R for Data Science. Introduction So far you’ve seen R Markdown used to produce HTML documents.
This chapter gives a brief overview of some of the many other types of output you can produce with R Markdown. There are two ways to set the output of a document: What is the tidyverse? By Joseph Rickert Last week, I had the opportunity to talk to a group of Master’s level Statistics and Business Analytics students at Cal State East Bay about R and Data Science.
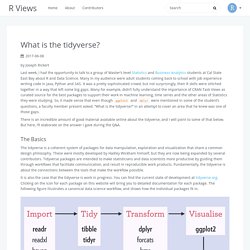
Many in my audience were adult students coming back to school with job experience writing code in Java, Python and SAS. It was a pretty sophisticated crowd, but not surprisingly, their R skills were stitched together in a way that left some big gaps. Many for example, didn’t fully understand the importance of CRAN Task Views as curated source for the best packages to support their work in machine learning, time series and the other areas of Statistics they were studying. So, it made sense that even though ggplot2 and dplyr were mentioned in some of the student’s questions, a faculty member present asked: “What is the tidyverse?” There is an incredible amount of good material available online about the tidyverse, and I will point to some of that below. The Basics. R - Replace NA with previous or next value, by group, using dplyr. RPubs. Enterprise Dashboards with R Markdown. Introduction to Statistical Learning.
Tag Archive – Sebastian Sauer Stats Blog. Beautiful thematic maps with ggplot2 (only) The above choropleth was created with ggplot2 (2.2.0) only.
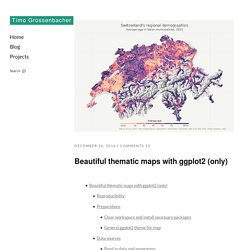
Well, almost. Of course, you need the usual suspects such as rgdal and rgeos when dealing with geodata, and raster for the relief. But apart from that: nothing fancy such as ggmap or the like. The imported packages are kept to an absolute minimum. In this blog post, I am going to explain step by step how I (eventually) achieved this result – from a very basic, useless, ugly, default map to the publication-ready and (in my opinion) highly aesthetic choropleth.
Reproducibility As always, you can reproduce, reuse and remix everything you find here, just go to this repository and clone it. Add different page numbers or number formats to different sections. Let's say you want to use different page numbers or number formats and styles in different parts of your document.
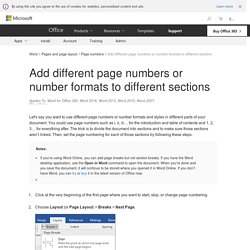
You could use page numbers such as i, ii, iii… for the introduction and table of contents and 1, 2, 3… for everything after. The trick is to divide the document into sections and to make sure those sections aren’t linked. Then, set the page numbering for each of those sections by following these steps. Notes: If you're using Word Online, you can add page breaks but not section breaks. Click at the very beginning of the first page where you want to start, stop, or change page numbering. Ggplot2 - Easy Way to Mix Multiple Graphs on The Same Page - Articles. To arrange multiple ggplot2 graphs on the same page, the standard R functions - par() and layout() - cannot be used.
The basic solution is to use the gridExtra R package, which comes with the following functions: grid.arrange() and arrangeGrob() to arrange multiple ggplots on one pagemarrangeGrob() for arranging multiple ggplots over multiple pages. However, these functions makes no attempt at aligning the plot panels; instead, the plots are simply placed into the grid as they are, and so the axes are not aligned.
If axis alignment is required, you can switch to the cowplot package, which include the function plot_grid() with the argument align. Simple, blog-aware, static sites. R Handbook: Regression for Count Data. Introduction Count data In general, common parametric tests like t-test and anova shouldn’t be used for count data.
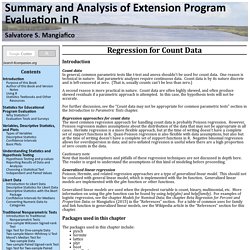
One reason is technical in nature: that parametric analyses require continuous data. Count data is by its nature discrete and is left-censored at zero. (That is, usually counts can’t be less than zero.) Modelling mortality rates using Poisson regression. Using RStudio Themes. Note: This feature is only available in RStudio Preview, 1.1 or higher.
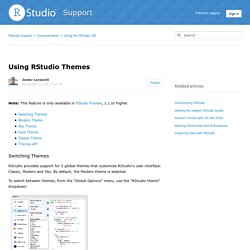
Switching Themes RStudio provides support for 3 global themes that customize RStudio's user interface: Classic, Modern and Sky. By default, the Modern theme is selected. To switch between themes, from the "Global Options" menu, use the "RStudio theme" dropdown: Modern Theme. Strategies To Speedup R Code. The for-loop in R, can be very slow in its raw un-optimized form, especially when dealing with larger data sets. There are a number of ways you can make your logics run fast, but you will be really surprised how fast you can actually go. This chapter shows a number of approaches including simple tweaks to logic design, parallel processing and Rcpp, increasing the speed by orders of several magnitudes, so you can comfortably process data as large as 100 Million rows and more.
Lets try to improve the speed of a logic that involves a for-loop and a condition checking statement (if-else) to create a column that gets appended to the input data frame (df). The code below creates that initial input data frame. Statistical Tests. This chapter explains the purpose of some of the most commonly used statistical tests and how to implement them in R 1. One Sample t-Test Why is it used? It is a parametric test used to test if the mean of a sample from a normal distribution could reasonably be a specific value. set.seed(100) x <- rnorm(50, mean = 10, sd = 0.5) t.test(x, mu=10) # testing if mean of x could be#=> One Sample t-test#=> #=> data: x#=> t = 0.70372, df = 49, p-value = 0.4849#=> alternative hypothesis: true mean is not equal to 10#=> 95 percent confidence interval:#=> 9.924374 10.157135#=> sample estimates:#=> mean of x #=> 10.04075.
Daattali/addinslist: Discover and install useful RStudio addins. When a Variable’s Level of Measurement Isn’t Obvious. Tutorial 11.7a - Poisson regression and log-linear models. 23 April 2014 Generalized linear mixed effects models Tutorials 9.15a, 9.7a, 9.8a and 9.8a introduced hierarchical (or mixed effects) designs and models in which sampling units are arranged in space and time so as to reduce associated sources of unexplained variability and the models incorporate some provisions for resulting dependency structure. Tutorials 11.4, 11.4a, and 11.5a introduced linear models that accommodated residual distributions other than Gaussian (normal) distributions. Parameter estimation. Writage - Markdown plugin for Microsoft Word. Word to Markdown Converter. Online Kramdown Editor. Markdown : Công cụ viết cho những nhà phát triển phần mềm.
Ghi chép tất cả mọi thứ bằng Markdown. Sơ sơ về ngôn ngữ đánh dấu văn bản Markdown và các công dụng của nó. Barnard’s exact test – a powerful alternative for Fisher’s exact test (implemented in R) (The R code for Barnard’s exact test is at the end of the article, and you could also just download it from here) About Barnard’s exact test About half a year ago, I was studying various statistical methods to employ on contingency tables. I came across a promising method for 2×2 contingency tables called “Barnard’s exact test“. Barnard’s test is a non-parametric alternative to Fisher’s exact test which can be more powerful (for 2×2 tables) but is also more time-consuming to compute (References can be found in the Wikipedia article on the subject).
The test was first published by George Alfred Barnard (1945). When comparing Fisher’s and Barnard’s exact tests, the loss of power due to the greater discreteness of the Fisher statistic is somewhat offset by the requirement that Barnard’s exact test must maximize over all possible p-values, by choice of the nuisance parameter, π. Creating pdf-forms with LaTeX · Martin Thoma. I've just stumbled across a full, working example how to create a html form within an LaTeX document. You can fill this form within your PDF-Reader. Here is the example PDF-file. Pdftools. Beamer - How do you scale image to fit size of the paper? R - How to set size for local image using knitr for markdown? R: Default and current chunk options. Description. Options - Chunk options and package options - Yihui Xie. The knitr package shares most options with Sweave, but some were dropped/changed and some new options were added. The default values are in the parentheses below.
Lorenzwalthert/strcode: Structure your code better. Yonicd/rsam: RStudio Addin Manager. MilesMcBain/datapasta: On top of spaghetti, all covered in cheese.... Tjmahr/WrapRmd: RStudio addin for wrapping RMarkdown paragraphs. What are your favorite Rstudio addins? - RStudio IDE - RStudio Community. R-lib/styler: Non-invasive pretty printing of R code. Benmarwick/snakecaser: An RStudio Add-in to convert text to snake_case (e.g. for making object names) ThinkR-open/remedy: RStudio Addins to Simplify Markdown Writing. Benmarwick/rrtools: rrtools: Tools for Writing Reproducible Research in R. Sfr/RStudio-Addin-Snippets: RStudio add-in to copy data to clipboard, reverse slashes, insert and reformat pipes. Faster rendering in RStudio - Jeff’s GitHub Pages site.
Nearly all of the analysis I do in R is in the form of RMarkdown documents. I tend to build these documents iteratively, adding or modifying code chunks progressively and rendering the document to HTML to see the results. For some time I accomplished this with three applications: a text editor (I use TextMate), a Terminal window running R, and a Safari window. I created two custom commands and bound them to shortcut keys in TextMate: Command-K (for Knit), which sends rmarkdown::render("active_document.Rmd") to the R Terminal window, and Command-P, which opens active_document.html in Safari.
This allows me to quickly render my document and view the resulting HTML. Although this setup generally works well for me, I’ve been wanting to move my workflow over to RStudio ever since I saw its impressive (and highly useful) code diagnostics feature. With RStudio’s new addin support, I decided to build a simple addin for rendering the current RMarkdown document in the console session. Bnosac/taskscheduleR: Schedule R scripts/processes with the Windows task scheduler. Local tips for R - Rudolf Cardinal. These pages provide a few short guides to getting going with R, a free statistical package. Ggplot2 extensions: ggnetwork. Scheduling R Markdown Reports via Email.
“Mail merge” with RMarkdown. The term “mail merge” might not be familiar to those who have not worked in an office setting, but here is the Wikipedia definition: Mail merge is a software operation describing the production of multiple (and potentially large numbers of) documents from a single template form and a structured data source. The letter may be sent out to many “recipients” with small changes, such as a change of address or a change in the greeting line.Source: Why I would rather use ReporteRs than RMarkdown. Over the last year I have been involved in a large number of training courses and projects that have involved reporting in Microsoft Excel, Word and Powerpoint in some way.
However, my default is not to jump straight to dynamic reporting tools like knitr and RMarkdown or Shiny. Useful tricks when including images in Rmarkdown documents. Rmarkdown is an enormously useful system for combining text, output and graphics generated by R into a single document. Images, in particular, are a powerful means of communication in a report, whether they be data visualizations, diagrams, or pictures. R Quick Tip: parameter re-use within rmarkdown YAML. Using Magick with RMarkdown and Shiny. 13 Jobs for R users from around the world (2017-11-06) Automating Summary of Surveys with RMarkdown.
New data visualization features in ggplot2 update. Interactive, web-ready ggplot2-style graphics with ggvis. Ggvis vs ggplot2. Creating a Science Conference Poster with Inkscape. Introduction to tableone. R - Change value of variable with dplyr. Tables in R (And How to Export Them to Word) Ms word - using stargazer in R without knowing anything about latex. Benmarwick/wordcountaddin: Word counts and readability statistics in R markdown documents. Count words and characters in Rstudio. Count the number of words in a string in R? ConvertGraph. Read text files with readtext() Skranz/svgdiagram: R package to create svg from .gv graphviz file. Cannot output any DiagrammeR graph to a pdf file through knitr · Issue #133 · rich-iannone/DiagrammeR.
Slidify package not available in R 3.1.2? Slidify: Modern, simple presentations written in R Markdown. R - How to select the rows with maximum values in each group with dplyr? R - Remove duplicates keeping entry with largest absolute value. R - Find duplicated elements with dplyr. An Example R Markdown. Identifying and Removing Duplicate Data in R - Easy Guides - Wiki - STHDA. Import, Export, and Convert Data Files. Introduction to tableone. Data types, part 3: Factors!
Convert PDF to JPG in High Quality Online. Useful tricks when including images in Rmarkdown documents (Revolutions) PDF to Keynote. Conversion - Beamer-Generated slides to PPT? - TeX - LaTeX Stack Exchange. How to use R for matching samples (propensity score) Version Control with Git. Reference Extractor. Quick list of useful R packages.
Templates. R - Figure position in markdown when converting to PDF with knitr and pandoc. The magick package: Advanced Image-Processing in R.