
▷ crowdfunding.ch. What About Me? A Few Rules for Making Homemade Infographics. Like many other fans of infographics, we were excited about today's launch of Visual.ly, a site that helps normal folk create infographics.
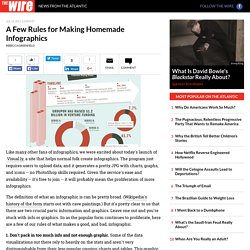
The program just requires users to upload data, and it generates a pretty JPG with charts, graphs, and icons -- no PhotoShop skills required. Given the service's ease and availability -- it's free to join -- it will probably mean the proliferation of more infographics. The definition of what an infographic is can be pretty broad. (Wikipedia's history of the form starts out with cave paintings.) But it's pretty clear to us that there are two crucial parts: information and graphics. Getting started with Infographics 1 – Advice on Web Design, Graphic Design, and Social Media. 14 Apr Tweet This past weekend I got to work with some really talented photographers for the first time.

George from D&D Photography and Jimmy from Clickr Photography. I’ve done a bunch of photo shoots before but never at a beach. While Read More 08 Apr Tweet The 2014 FIFA World Cup will be the 20th FIFA World Cup, an international men’s association football tournament that is scheduled to take place in Brazil from 12 June to 13 July 2014. Read More 07 Apr Tweet 1.No Down Payment You should receive half of the agreed upon price up front. Read More 06 Apr Tweet I must admit that this 7 min video is one of the funniest I’ve seen in a while when it comes to project team meetings. Read More 14 Mar Tweet If you’ve ever tried to photograph kids, you know that it’s a tough job. Read More 07 Mar Tweet About a week ago I had the privilege to shoot an engagement shoot with a young couple here in Orlando for their upcoming wedding in September of this year.
Read More 21 Feb Read More 20 Feb Read More 11 Feb 20 Jan. Tips, tricks and resources to make your own gorgeous infographics. Infographics (or Information Graphics) are graphic visual representations of data or information, presented in a way to make it easier to consume information.
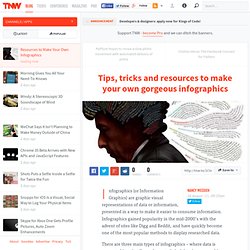
Infographics gained popularity in the mid-2000′s with the advent of sites like Digg and Reddit, and have quickly become one of the most popular methods to display researched data. There are three main types of infographics – where data is presented in a timeline, where statistical data is presented in graphs or with icons, or where data is presented on a map. In order to create an infographic which will be widely shared, think about your typography, colours, and layout. Make it easy for people to understand the information that’s being provided. Venngage.
6 Reasons Most Infographics Don't Cut It. You might have noticed that there's been an explosion of infographics over the last year or two.
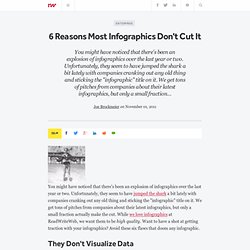
Unfortunately, they seem to have jumped the shark a bit lately with companies cranking out any old thing and sticking the "infographic" title on it. We get tons of pitches from companies about their latest infographics, but only a small fraction actually make the cut. While we love infographics at ReadWriteWeb, we want them to be high quality. Want to have a shot at getting traction with your infographics? Avoid these six flaws that doom any infographic. They Don't Visualize Data Once upon a time, infographics performed a really valuable function. Now, it's not absolutely mandatory for an infographic to visualize hard data. You can also use infographics to tell a (short) story.
But many other infographics just slop together some random facts and figures without contributing much at all. Too Company Specific or Self-Promotional This is a common problem with marketing in general. Ugly Graphics. Not an Infographic. Tools And Resources For Creating Infographics. Infographics.
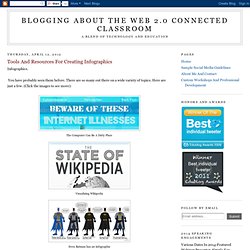
You have probably seen them before. There are so many out there on a wide variety of topics. Here are just a few. (Click the images to see more): These really are a great way to visualize data. Here are a few of my favorite sites and tools to use when creating infographics. Wordle: Chances are this is one you have heard of. Visual.ly: It doesn't get much simpler than using Visual.ly. Stat Silk: This is a set of tools that you can download to create interactive maps and charts. Creately: Creatly is an online mindmapping program that is pretty powerful. Google Public Data Explorer: It probably goes without saying but Google has access to lots of data. Aviary Phoenix-Once you gather your images, charts and graphics, you are going to need a way to put them together.
Kathy Schrock has an entire webiste dedicated to using infographics in the classroom. What other sites do you use to visualize data? The Best Resources For Creating Infographics. Infographics are visual representations of data design to help communicate information clearly.
They are great for English Language Learners, and the rest of us, too! The information can also be either serious or humorous. To see examples of some of the best ones, you can visit: The Best Infographics — 2010. Infographics as a Creative Assessment. Easel.ly. Piktochart.