Smithsonian's History Explorer. That Was History. Image Gallery - History Sights and Sounds. This image gallery brings the U.S. census, from 1790 to 2010, alive using photographic images.
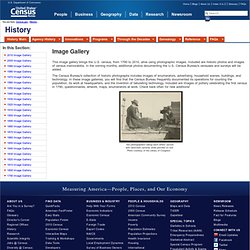
Included are historic photos and images of census memorabilia. In the coming months, additional photos documenting the U.S. Census Bureau's censuses and surveys will be added. The Census Bureau's collection of historic photographs includes images of enumerators, advertising, household scenes, buildings, and technology. In these image galleries, you will find that the Census Bureau frequently documented its operations for counting the population, its work at headquarters, and the invention of tabulating technology.
Two photographers taking each others' picture with hand-held cameras while perched on roof. Create and share visual ideas online. Knoema - Home. International Human Development Indicators - UNDP. Images of art, history and science for educational and commercial licensing. ChronoZoom. ChronoZoom is an educational tool for teachers and students who want to put historical events in perspective.

A great many resources have been created already in ChronoZoom for your enjoyment and enlightenment. Start Exploring Use ChronoZoom to get a perspective of the extensive scale of time and historical events relative to what happened around the world. Become an author yourself! Simply log on with your social networking credentials to record your unique perspective or tell a story that needs to be told. New Teacher Resources RT @MSFTResearch: See how #Chronozoom helps students “think historically” & travel though time with 3 newly created curriculum modules http… #chronozoom is a valuable tool for illustrating Climate Change: @metanexus Anyone can author their small or Big History on the 14 Billion year timeline at - an open source project.
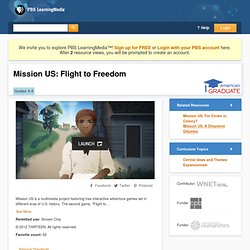
@BillGates Congratulations to the Big History Project. National Archives Experience : Digital Vaults. Playing History. Mission US: For Crown or Colony? Mission US: Flight to Freedom. Mission US is a multimedia project featuring free interactive adventure games set in different eras of U.S. history.
The second game, "Flight to ... The Agricultural Revolution: Crash Course World History #1. 2011 in 11 graphs. Student News. The Best Sites That Show Statistics By Reducing The World & The U.S. To 100 People. Reducing statistics to “if _________ were 100 people, then __________” can make them very accessible, engaging, and thought-provoking.
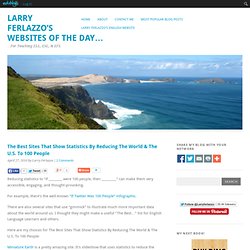
For example, there’s the well-known “If Twitter Was 100 People” infographic. AAEC - Association of American Editorial Cartoonists. What is the reality about immigration?
Teachers: Download the lesson and print it out for use in your classroom. (PDF format) Common Core State Standard RL.CSS.2/4 Grades 6-12: Students determine the meaning of political cartoons through the analysis of their literal, symbolic and figurative meanings of the elements the artist used and their effect. Students are asked to describe the overall effect of the cartoon, and how the artist’s choices combine to create that effect. Gender Inequality Index. Curiosity. Travel Through Time. Home - Poverty Over - Christian Aid. TES collection World War II. Comment:5 average rating | Comments (9)Last Updated:9 March, 2014Section:Resources Primary History - World War II Using rich resources that encourage children’s empathy skills can make all the difference in teaching about WWII.

This collection has detailed lesson plans, sources of information, emotive images, audio interviews, film footage and display materials. Lesson planning DavidHowes1977 has shared his wonderfully detailed plans for KS2, together with a large range of supporting resources: Medium Term Plan Audio resource links Lesson 1 timeline/reasoning Lesson 2 air raids/blitz Lesson 3 evacuees Lesson 4 rationing Lesson 5 ration cake recipe Lesson 6 women in WWII More resources What was it like for children to live in WWII? This resource includes a medium term plan, 12 lesson plans, an activity, worksheets and full colour pictures. Webrangers. This is the National Park Service's site for kids of all ages.
If you love our National Parks, Monuments and Historic Sites, this site is for you. If you are new to our National Parks, we hope this site helps you experience how wonderful they can be. We've recently updated this site to make it even more fun. You can now customize you Ranger Station, earn more rewards, and play new activities! For Teachers. Do you want to use Gapminder tools in your classroom?
Check out all our resources on this page and the downloads page to get started. For more info, contact our educational staff at mikael@gapminder.org and olof.granstrom@gapminder.org . Featured examples of Gapminder in education Teachers TV: Looking at statistics with Year 8 students[Javascript required to view Flash movie, please turn it on and refresh this page]Thanks to: Bob LangGapminder and Worldmapper Geography for a changing world resources from the Geographical Association, UK.Thanks to: Paula CooperGapminder course at the NYC iSchool An experimental high school course that challenges 10th and 11th grade students to use a quantitive lens to analyze the last 200 years of global history.Thanks to: Jesse Spevack.
Tour. Interactive visualization Comments about this visualization Form for posting a new comment Detail of a comment contributed by anonymous user Screenshot showing part of the collection of visualizations on the site.