
IntelliTamper Download. IntelliTamper is a tiny but very practical tool that you can use to scan a website in order to reveal all its files and folders, including the unlisted ones.
Easy-to-trigger actions The interface is extremely simple to use. Write the name of the website in the address bar and hit the Enter button. IntelliTamper thoroughly scans and displays all contents found on that particular website (including extra links) in alphabetical order (the program uses a dictionary). Website scan results Results are shown in an Explorer-based layout. You can also access files directly from IntelliTamper, as if you were reading them from your hard drive. Several flaws Unfortunately, IntelliTamper crashes one too many times (at least on Windows 7), especially when adding a new website to be scanned, without first stopping the current scan. Conclusion What can you do with this software? 22 cartes qui vont changer votre façon de voir le monde ! La 8 est difficile à croire, mais c'est pourtant vrai !
Leaked Email Reveals Who's Who List of Climate Denialists. ICN reporters Lisa Song and Zahra Hirji contributed to this story.
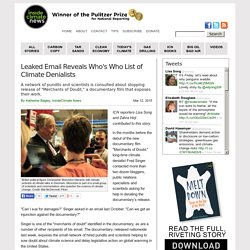
In the months before the debut of the new documentary film "Merchants of Doubt," long-time climate denialist Fred Singer contacted more than two dozen bloggers, public relations specialists and scientists asking for help in derailing the documentary’s release. "Can I sue for damages?” Singer asked in an email last October. "Can we get an injunction against the documentary? " Singer is one of the "merchants of doubt" identified in the documentary, as are a number of other recipients of his email. Singer's email became public earlier this week when it was leaked to journalists. Many of those copied on the email thread, such as Singer and communications specialist Steven Milloy, have financial ties to the tobacco, chemical, and oil and gas industries and have worked to defend them since the 1990s.
Here is InsideClimate News' guide to those who were on the emails, in alphabetical order: Ron Arnold Timothy Ball Joseph "Joe" Bast S. Data Journalism in Switzerland: The Spaceship Has Landed. Data Journalism in Switzerland: The Spaceship Has Landed March 13, 2011 (updated on March 13, 2014) It’s about half a year ago that I thought to myself something needed to be done about data journalism in Switzerland.
While this branch of journalism is getting increasingly important, with The Guardian, The New York Times and others demonstrating how powerful it can be almost every day, Switzerland has been pretty apathetic about it. So what do you do? You try to learn from the best and find other journalists in Switzerland, eager to come along. That workshop took place yesterday and it certainly lived up to my hopes of being a sort of kick-starting moment for data journalism in Switzerland. I’ll try to give a brief summary of what Simon Rogers taught us about data journalism, hoping that the fascination will spread well beyond the workshop. Key Facts Key Quotes Data Journalism is about using data to make a point. I’m not a techie, not even a statistician. Nonpartisan, non-advocacy public opinion polling and demographic research. Newest Questions. Alpha: Computational Knowledge Engine.
How-to-build-dashboards. Teaching data visualization: Recommended readings, resources. I want to share the reading/resource list in my data visualization course; the list breaks into six sections: intro to data viz, choosing the right chart, designing a nice-looking visulization, communicating your message, tools/tips, and resources.
This list will be a work in progress and all suggestions are welcomed. Intro to data visualization A Quick Illustrated History of Visualization: Data visualization has its roots in a long historical tradition of representing information using pictures in ways that combine art, science and statistics. Visage - Create and Automate Beautiful Reports. What data journalism told us about #Ferguson. What data journalism told us about #Ferguson Data journalism in 2014 has taken a shift towards instant reporting: today it is about applying analysis and discovering data around events in the news as soon as they happen.
It’s been a week since the police shooting of unarmed Michael Brown in Ferguson, Missouri, what have we learned from data journalists about the events and issues behind the unrest which followed? ANTHONY VEYSSIERE - Développeur Designer Freelance. The GDELT Project. Infographies. The Gulf/2000 Project - SIPA - COLUMBIA UNIVERSITY. Maps and Statistics Collections All maps and their accompanying texts that are hosted by this Gulf/2000 web site are original, authored and produced by Dr.
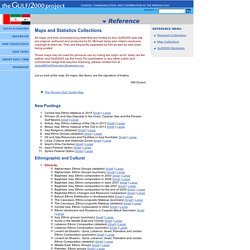
Michael Izady who retains exclusive copyright to them all. They are frequently upgraded by him as well as new ones being posted. These maps may be used for personal use by noting the origin as Dr. Human Data Interactions. Pantheon - Visualizations. OEC: Les produits exportés par Belgique (2010) 100 Premium Infographics from Ingimage - only $18. Data.
It's what makes the world go round. How you use and share that data, however, can be a true challenge.
Doc et théorie. Couleurs. Listing outils.