
Zanifesto. Draw.io. Adioma - Infographic Maker With Timelines, Grids and Icons. Create Interactive Online Presentations & free Infographic software. HTML5 Animations, download & Publish. Online Diagram Software to draw Flowcharts, UML & more.
Vizualize.me: Visualize your resume in one click. Create and share visual ideas using infographics. 20+ Tools to Create Your Own Infographics. A picture is worth a thousand words – based on this, infographics would carry hundreds of thousands of words, yet if you let a reader choose between a full-length 1000-word article and an infographic that needs a few scroll-downs, they’d probably prefer absorbing information straight from the infographic. What’s not to like? Colored charts and illustrations deliver connections better than tables and figures and as users spend time looking back and forth the full infographic, they stay on the site longer. Plus, readers who like what they see are more likely to share visual guides more than articles.
While not everyone can make infographics from scratch, there are tools available on the Web that will help you create your very own infographics. In this article, we’re listing more than 20 such options to help you get your messages across to your readers, visually. Read Also: The Infographic Revolution: Where Do We Go From Here?
Easel.ly Debutes Online Editor of Infographics. San Diego-based start-up Easel.ly [easel.ly] is offering a beta service that allows lay people to design and implement their own "infographics" via an online editor.
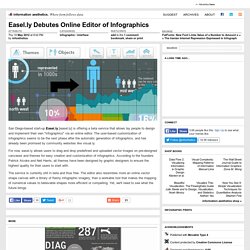
The user-based customization of infographics seems to be the next phase after the automatic generation of infographics, and has already been promised by community websites like visual.ly. Free Infographic Maker. Thinkmap visualization software facilitates communication, learning, and discovery.
VisGIF Home Page. Image A8JK. It - What are Infovis and Datavis about? by closr. How to Use FF Chartwell. Primarily suitable for Adobe Creative Suite, FF Chartwell for print uses OpenType ligatures to transform strings of numbers automatically into charts.
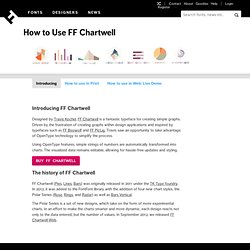
The data remains in a text box, allowing for easy updates and styling. It’s really simple to use; you just type a series of numbers like: ‘10+13+37+40’, turn on Stylistic Alternates or Stylistic Set 1 and a graph is automatically created. To help get you started using FF Chartwell we’ve created this video tutorial and here are some simple steps: ONE — Firstly always make sure the letter spacing is set to “0” (zero) TWO — Using the values 0-100, type the values, then use “+” to combine them into one chart. FatFonts. FatFonts is a graphical technique conceived and developed by Miguel Nacenta, Uta Hinrichs, and Sheelagh Carpendale.
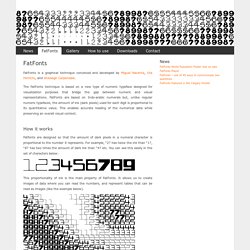
The FatFonts technique is based on a new type of numeric typeface designed for visualization purposes that bridge the gap between numeric and visual representations. FatFonts are based on Indo-arabic numerals but, unlike regular numeric typefaces, the amount of ink (dark pixels) used for each digit is proportional to its quantitative value. This enables accurate reading of the numerical data while preserving an overall visual context.
Diagram software. Over 100 Incredible Infographic Tools and Resources (Categorized) This post is #6 in DailyTekk’s famous Top 100 series which explores the best startups, gadgets, apps, websites and services in a given category.

Total items listed: 112. Infographic Tool For Non-Designers:Piktochart Infographics. 20+ Tools to Create Your Own Infographics. Free infographic app. Tips, tricks and resources to make your own gorgeous infographics. Infographics (or Information Graphics) are graphic visual representations of data or information, presented in a way to make it easier to consume information.
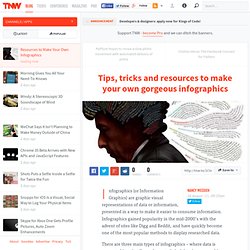
Infographics gained popularity in the mid-2000′s with the advent of sites like Digg and Reddit, and have quickly become one of the most popular methods to display researched data. There are three main types of infographics – where data is presented in a timeline, where statistical data is presented in graphs or with icons, or where data is presented on a map. In order to create an infographic which will be widely shared, think about your typography, colours, and layout. Infographics and other tools of news visualization. Create Infographics online. InfoGraphic Designs: Overview, Examples and Best Practices.
Information graphics or infographics are visual representations of information, data or knowledge.
These graphics are used where complex information needs to be explained quickly and clearly, such as in signs, maps, journalism, technical writing, and education. They are also used extensively as tools by computer scientists, mathematicians, and statisticians to ease the process of developing and communicating conceptual information. They can present a rich amount of information without intimidating you. Or sometimes they intimidate you, but make the digesting of the information much more bearable. Here in this article below, we are going to discuss best practices for designing infographics followed by some examples which might help you learn a thing or two.
You may be interested in the following related articles as well. Visualizing.org. Diagramly – A Handy Tool For Creating Quick Flowcharts. The best thing about Diagramly is how accessible it is.

You just click a URL, and you’re in. There’s no download, no account registration, and you don’t even need Flash to use it. Create Infographics. A Few Rules for Making Homemade Infographics. Like many other fans of infographics, we were excited about today's launch of Visual.ly, a site that helps normal folk create infographics.
The program just requires users to upload data, and it generates a pretty JPG with charts, graphs, and icons -- no PhotoShop skills required. Given the service's ease and availability -- it's free to join -- it will probably mean the proliferation of more infographics. The definition of what an infographic is can be pretty broad. (Wikipedia's history of the form starts out with cave paintings.) 17 Resources to Help You Create Killer Infographics. In the previous post, Alexis provided some great tips for designing awesome infographics.
Kinzaa. 10 Fun Tools To Easily Make Your Own Infographics. People love to learn by examining visual representations of data. That’s been proven time and time again by the popularity of both infographics and Pinterest. So what if you could make your own infographics ? What would you make it of? It’s actually easier than you think… even if you have zero design skills whatsoever. Below are my two favorite infographic-making web 2.0 tools that I highly recommend. Click the name of each tool to learn more! 4 Simple Tools for Creating an Infographic Resume.
This post originally appeared on the American Express OPEN Forum, where Mashable regularly contributes articles about leveraging social media and technology in small business.
As a freelancer or job seeker, it is important to have a resume that stands out among the rest — one of the more visually pleasing options on the market today is the infographic resume. 10 Awesome Tools To Make Infographics. Advertisement Who can resist a colourful, thoughtful venn diagram anyway? In terms of blogging success, infographics are far more likely to be shared than your average blog post.
This means more eyeballs on your important information, more people rallying for your cause, more backlinks and more visits to your blog. In short, a quality infographic done well could be what your blog needs right now. 9 Amazing Word Cloud Generators. Welcome to a series of posts devoted to the use of Word Clouds. I know you will find new information… whether you are a seasoned user of word clouds, or brand new. I am certain you will enjoy reading about these nine amazing Word Cloud Generators. In the last two posts you already discovered 12 Tips in Using Wordle and 108 ways for educators to use word clouds in the classroom. Vizualize.me: Visualize your resume in one click. Data visualisation and Infographics tools.