
La population en cartes interactives - Les graphiques/ les cartes. Carto.observatoire-des-territoires.gouv. Atlases of social inequalities. Data and evidence Equity in health project Interactive atlases Atlases of social inequalities Atlases of social inequalities Atlases of inequalities allow visualization of the difference between a target value and the value in a region or group of regions.

The target value is the population weighted average of the most advantaged quintile of the population with available data and is considered as an achievable goal. Differences between the target and the individual region are visualized as absolute differences (area target differences) and as relative differences (area target ratios). Amenable mortality atlases, by socio economic variable Income of households - Disposable income, net (uses) - Purchasing power standard based on final consumption per inhabitant Percentage of population by highest level of education attained - Pre-primary, primary and lower secondary education - levels 0-2 (ISCED 1997) - Both sexes - Between 25 and 64 years Infant mortality rate Infant mortality rate.
Bases de données - Cartes interactives. Atlas statistique de la Suisse. Version en ligne (gratuitement) La version en ligne de l'atlas est actualisée en permanence et est accessible en tout temps.
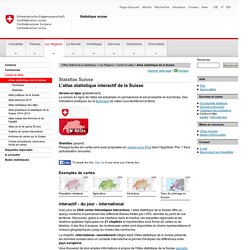
Des indications pratiques sur la technique de l'atlas vous faciliteront la tâche. iStatatlas (payant) Presque toutes les cartes sont aussi proposées en version pour iPad dans l'AppStore. Prix: 1 franc (actualisation annuelle). Avec plus de 2500 cartes thématiques interactives, l’atlas statistique de la Suisse offre un aperçu moderne et permanent des différents thèmes traités par l’OFS, abordés du point de vue territorial. Découvrez, grâce à une interface claire et intuitive, les disparités régionales et les relations spatiales regroupées en 21 chapitres et représentées sous forme de cartes ou de tabelles. AIRE. BresilagriMonde. SIT PNR. Observatoire des votes en France de 1992 à 2012 - Geoclip3. WorldMap - un SIG en ligne par l'université d'Harvard.
Welcome! - WorldMap. My Map. .... Annuaire de la Géomatique et des SIG > France découverte par Géoclip O3. Édugéo — Éducnet. Saratov.rekod. Maratlas. Flex Projector. Global Risks Portfolio. Alpage. ALPAGE (diachronic analysis of the Paris urban area: a geomatic approach) is a research program coordinated by Hélène Noizet (LAMOP), which is supported by the ANR.
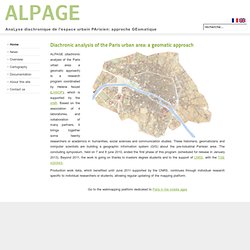
Based on the association of 4 laboratories, and collaboration of many partners, it brings together some twenty researchers or academics in humanities, social sciences and communication studies. These historians, geomaticians and computer scientists are building a geographic information system (GIS) about the pre-industrial Parisian area. The concluding symposium, held on 7 and 8 june 2010, ended the first phase of this program (scheduled for release in January 2013). Beyond 2011, the work is going on thanks to masters degree students and to the support of CNRS, with the TGE ADONIS. Production work data, which benefited until June 2011 supported by the CNRS, continues through individual research specific to individual researchers or students, allowing regular updating of the mapping platform.
Géoclip. TargetMap.com Starting Steps by Carlos Mauri on Prezi. Gridded Population of the World - GPW v3. Introduction Note: "Gridded Population of the World, v4" is now available and supersedes GPWv3.
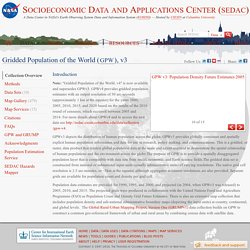
GPWv4 provides gridded population estimates with an output resolution of 30 arc-seconds (approximately 1 km at the equator) for the years 2000, 2005, 2010, 2015, and 2020 based on the results of the 2010 round of censuses, which occurred between 2005 and 2014. For more details about GPWv4 and to access the new data see GPWv3 depicts the distribution of human population across the globe. GPWv3 provides globally consistent and spatially explicit human population information and data for use in research, policy making, and communications. Population data estimates are provided for 1990, 1995, and 2000, and projected (in 2004, when GPWv3 was released) to 2005, 2010, and 2015. SIG Politique de la Ville. SIG - List.