
O que é o NVivo? Discurso de Renan Calheiros antes da votação. A JavaScript toolkit for visualising networks. Open Data Tools - Visualization. Visualizing.org Community- and info platform around data visualizations.
FlowingData Blog around data visualization, infographics and statistics. Google Chart Tools. Create and Share Interactive Maps Online. Welcome to Viewshare. The Best Tools for Visualization. Visualization is a technique to graphically represent sets of data.
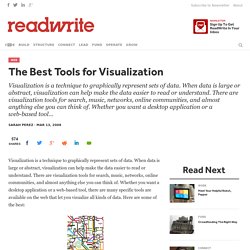
When data is large or abstract, visualization can help make the data easier to read or understand. There are visualization tools for search, music, networks, online communities, and almost anything else you can think of. OpenTTD Gource Visualisation. Population Dynamics 1970-2010 (NoTree). Gource. Register. Análise de Redes com NODEXL – Parte 1 « Metodologia em Ciência Política. Creator. Processing ...
Personal $ Svg $20 ✓ Up to $75 merchandises for personal use. Merchandise $ License to use artwork in merchandises (T-Shirt, Mug, poster, etc). How to Create a Mind - About the Book. Book Summary Hardcover: 336 pages Publisher: Viking Adult (November 13, 2012) Language: English ISBN-10: 0670025291 ISBN-13: 978-0670025299 Now, in his much-anticipated How to Create a Mind, he takes this exploration to the next step: reverse-engineering the brain to understand precisely how it works, then applying that knowledge to create vastly intelligent machines.

Drawing on the most recent neuroscience research, his own research and inventions in artificial intelligence, and compelling thought experiments, he describes his new theory of how the neocortex (the thinking part of the brain) works: as a self-organizing hierarchical system of pattern recognizers. Kurzweil shows how these insights will enable us to greatly extend the powers of our own mind and provides a roadmap for the creation of superintelligence—humankind's most exciting next venture. Download Introduction (456 KB) to How to Create a Mind. Os melhores aplicativos pro Facebook ~ Tecle 1 Informação e Diversão. FbDownloader - Download your facebook photos. Beautiful web-based People Plots and Family Trees. Redsocial.jpg (1250×859) Redes Sociais: Infográfico Animado. Flickr – Compartilhamento de fotos! Flickr – Compartilhamento de fotos! Como são as coligações para governador. i2 Analyst's Notebook.
Data analysis and visualization for effective intelligence analysis IBM® i2® Analyst’s Notebook® is a visual intelligence analysis environment that can optimize the value of massive amounts of information collected by government agencies and businesses.
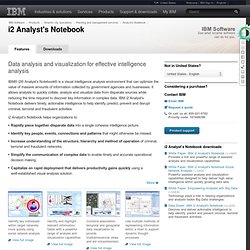
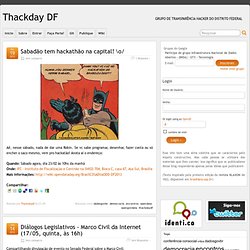
It allows analysts to quickly collate, analyze and visualize data from disparate sources while reducing the time required to discover key information in complex data. IBM i2 Analyst’s Notebook delivers timely, actionable intelligence to help identify, predict, prevent and disrupt criminal, terrorist and fraudulent activities. Google Translate. Conversação em Rede, A - Comunicação mediada pelo computador e redes sociais na Internet / Raquel Recuero. Raquel Recuero. Recorded Future: Get started in 2 minutes. InMaps - Visualize your LinkedIn network. Graphical Bios. Stunning. Simple. Www.scielo.br/pdf/ci/v30n1/a09v30n1.pdf. Social Network Analysis of 9-11 Terror Network. Tracking Two Identified Terrorists by Valdis Krebs Social Network Analysis [SNA] is a mathematical method for 'connecting the dots'.
SNA allows us to map and measure complex, and sometimes covert, human groups and organizations. Early in 2000, the CIA was informed of two terrorist suspects linked to al-Qaeda. Nawaf Alhazmi and Khalid Almihdhar were photographed attending a meeting of known terrorists in Malaysia. What do you do with these suspects? A Ciência das Redes. Www.celiojunior.com.br/arquivos/AnaliseRedesSociaisInteligenciaCorporativa.pdf. Learn how to use Gephi. Welcome to Gephi!
Gephi is an open-source software for visualizing and analysing large networks graphs. Gephi uses a 3D render engine to display graphs in real-time and speed up the exploration. You can use it to explore, analyse, spatialise, filter, cluterize, manipulate and export all types of graphs. Getting Started. Sem categoria » Thackday DF. Aê, nesse sábado, nada de dar uma Robin.
Não temos direito de esquecer - INFO Online - (28/01/2010) Create Your Timeline. Innolab 3D File Manager. Winner of the 2003 edition of NSF Science & Engineering Visualization Challenge, in the Illustration category, this ferris wheel-like arrangement, created by seniors at Boston University, was seen as an elegant solution for managing unwieldly amounts of information.
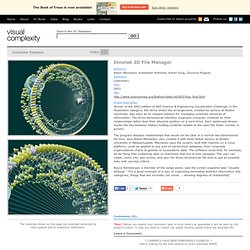
The three-dimensional interface organizes computer contents by their relationships rather than their physical position on a hard drive. Each spiderweb thread marks the ties between folders holding contents related to the open file folder (center, in purple). The program displays relationships that would not be clear in a normal two-dimensional file tree, says Adam Miezianko, who created it with three fellow seniors at Boston University in Massachusetts. Miezianko says the system, built with OpenGL on a Linux platform, could be applied to any sort of hierarchical database, from corporate organizational charts to genetic or ecosystems data.
Skyrails. Skyrails is a Social Network and Graph Visualization System with a built-in programming language.
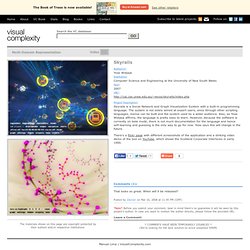
The system is not solely aimed at expert users, since through other scripting languages, menus can be built and the system used by a wider audience. Also, as Yose Widjaja affirms, the language is pretty easy to learn. However, because the software is currently on beta mode, there is not much documentation for the language and hence self-learning and guessing is the only way to go for now.
Yose says this will change in the future. There's a flickr page with different screenshots of the application and a striking video demo of the tool on YouTube, which shows the Scotland Corporate Interlocks in early 1900. The Wall Machine - Demo. CPI do Cachoeira. Geoprocessamento, mapas, imagens satélites, GPS, GIS. TREE BRANDING's BLOG. Funny Fake Facebook Walls - The Wall Machine.
Blog Archive Visualize your LinkedIn network with InMaps « If you’re a LinkedIn user, you already know the power of your professional network. What if you could visualize what your network looks like? Would your connections form clusters or groups? Wouldn’t it be great if you could see the way all your connections are related to each other? Even be able to identify the elusive hubs between your professional worlds? Now, you can! InMaps is an interactive visual representation of your professional universe that answers all of the above questions. INTELIGÊNCIA POLICIAL. A visual exploration on mapping complex networks. Navigator. Ministério da Justiça notifica Facebook por reconhecimento facial.
Canal de GephiOrg Gephi, an open source graph visualization and manipulation software. Introducing Gephi 0.7. Name in the New Testament. Skyrails Blog - Skyrails beta. Youtube video, flickr high-res screenshots ... 2396775983 The screenshots on flickr are orders of magnitude better than the ones you find here. download: ... lsdist.zip To install, just extract the folder to a directory, and run "first.exe". Coming soon: Stereo vision support. Galeria de skyrails. Skyrails, second build. R96944043 周伯相 FriendViz. Oliver Don. Interactive Social Network Visualization Friendviz. Interactive Social Network Visualization - FriendViz. The Eleven Essential Features of Sound Genealogy Software - GenoPro.
Microsoft sample showcases new technology, innovation in genealogy software. Microsoft sample showcases new technology, innovation in genealogy software What started out as a sample application to showcase the latest UI technology from Microsoft called Windows Presentation Foundation (WPF) resulted in a sample to the genealogy community of innovation. At the beginning of this year, the company I work for hired Vertigo Software to do a prototype application using WPF. Part of the portfolio that Vertigo shared with us during the pre-hiring phase was an end-to-end reference sample that they did for Microsoft. The exciting thing about this sample is that it is a genealogy application.
Family.Show version 1 was released in April in preparation for the MIX 07 conference and version 2 was released in July. Family.Show - Home. NetMiner Social Network Analysis Software - Script Package. NodeXL: Network Overview, Discovery and Exploration for Excel - Home. Social Seen: Analyzing and Visualizing Data From Social Networks. Augusto de Franco. Ucinet. Escola de Redes - A escola é a rede. Networks / Pajek. MEMEX - Informação, Cultura e Tecnologia [ISSN 1679-9208] - O Uso de Softwares para a Análise de Redes Sociais.
Rubeniki Fernandes de Limas Geórgia G. Sentinel Visualizer - Visualization and Analysis. Analytic Technologies.