
Hurricane and Cyclone Public Information Map. Leveraging digital networks for humanitarian response. Catch A Wave Home Page. Catch A Wave is an educational project for students, grades 6 - 12, that uses online real time data to guide student discovery of the causes and effects of ocean waves and tides.
The Earth's oceans are in constant motion and through this project, students will discover the causes and effects of the movement of the water on the shoreline and humans. Students will use real time and archived data from the internet and monitor water height all over the country. Students are challenged to think critically and creatively about the effects of ocean waves and tides. By the end of this project, students will be able to: distinguish the difference between semi-diurnal, diurnal and mixed tidesdetermine the effect of weather on wave heightsdetermine the effect of tides on biological organismsdetermine how much energy is in a wavelist engineering solutions used for coastal protection.
GSA EarthCache - Teacher Guide. Project Noah. Illustrated Story. EEK! - Cool Stuff. Weather Wiz Kids weather information for kids. EEK! - Cool Stuff. Discovery Education. The Secret Lives of Wild Animals. About Nature Works Everywhere. EarthEcho International. Google Crisis Map. 200th Activity Book. For 200 years, NOAA has been focused on delivering "science, service, and stewardship.
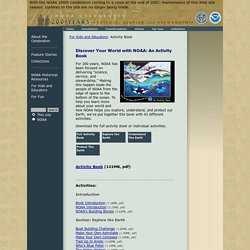
" Making this happen leads the people of NOAA from the edge of space to the bottom of the ocean. To help you learn more about your world and how NOAA helps you explore, understand, and protect our Earth, we've put together this book with 43 different activities. Download the full activity book or individual activities. Activity Book (121MB, pdf) Activities: Introduction Book Introduction (7.18MB, pdf) NOAA Introduction (2.23MB, pdf) NOAA’s Building Blocks (3.62MB, pdf) Section: Explore the Earth Section: Understand The Earth Follow That Hurricane (4.38MB, pdf) Build Your Own Weather Station (1.56MB, pdf) Be A Citizen Weather Reporter (682KB, pdf) Tornado In A Bottle (1.33MB, pdf) Be A Tree Ring Detective (1.98MB, pdf) Your Own El Nino (1.22MB, pdf) Please Pass The Salt (1.65MB, pdf) Satellite Communications (2.27MB, pdf) Wooly Magma (1.64MB, pdf) Survey Mark Hunting (1.91MB, pdf) Section: Protect The Earth.
Teacher Resources. State of Flux. All about population. A world population of 7 billion in 2011... and how many tomorrow?
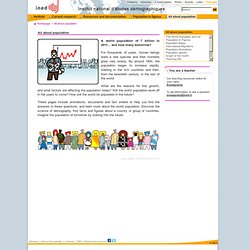
For thousands of years, human beings were a rare species and their numbers grew very slowly. By around 1800, the population began to increase rapidly, starting in the rich countries and then, from the twentieth century, in the rest of the world. What are the reasons for this growth, and what factors are affecting the population today? Will the world population level off in the years to come? How will the world be populated in the future?
These pages include animations, documents and fact sheets to help you find the answers to these questions, and learn more about the world population. Homepage : Homepage. Vital Signs of the Planet. Global Warming Effects Map - Effects of Global Warming. 3. Handprints, Not Footprints. A bag of chips I bought recently in England had some bad news printed on the back.

First, the chips had 14 g of fat. Worse, they had caused 75 g of carbon to be released into the atmosphere. That bag called my attention to my carbon footprint: those 75 g, added to the 2.3 million from the plane I took there and back, plus the total of all the carbon impacts--the emissions into the air that contribute to global warming--of everything else I do and buy. Footprint math uses life-cycle assessment, or LCA, which calculates the amount of carbon released... Subscribe Now Get TIME the way you want it One Week Digital Pass — $4.99 Monthly Pay-As-You-Go DIGITAL ACCESS — $2.99 One Year ALL ACCESS — Just $30! Climate Change.