
Where did IPCC 1990 Figure 7c Come From? Here at Climate Audit, we occasionally try to solve mysteries that have vexed climate scientists for years.
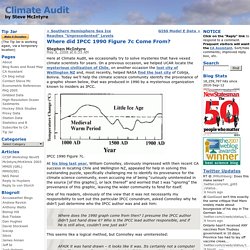
On a previous occasion, we helped UCAR locate the mysterious civilization of Chile, on another occasion the lost city of Wellington NZ and, most recently, helped NASA find the lost city of Cobija, Bolivia. Today we’ll help the climate science community identify the provenance of a graphic shown below, that was produced in 1990 by a mysterious organization known to insiders as IPCC. IPCC 1990 Figure 7c. At his blog last year, William Connolley, obviously impressed with then recent CA success in locating Chile and Wellington NZ, appealed for help in solving this outstanding puzzle, specifically challenging me to identify its provenance for the climate science community, even accusing me of being “curiously uninterested in the source [of this graphic], or lack thereof” and worried that I was “ignoring” the provenance of this graphic, leaving the wider community to fend for itself. A review of temperature reconstructions.
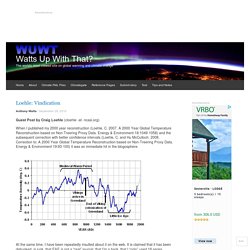
Guest essay by Andy May In previous posts (here and here), I’ve compared historical events to the Alley and KobashiGISP2 Central Greenland Temperature reconstructions for the past 4,000 years.

Unfortunately, these two reconstructions are very different. Recently Steve McIntyre has suggested a third reconstruction by Bo Vinther. Vinther’s data can be found here. Unfortunately, Vinther is often significantly different from the other two. All three reconstructions are shown in Figure 1. Figure 1. Loehle: Vindication. Guest Post by Craig Loehle (cloehle -at- ncasi.org) When I published my 2000 year reconstruction (Loehle, C. 2007.
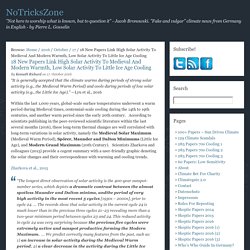
A 2000 Year Global Temperature Reconstruction based on Non-Treering Proxy Data. Energy & Environment 18:1049-1058) and the subsequent correction with better confidence intervals (Loehle, C. and Hu McCulloch. 2008. Correction to: A 2000 Year Global Temperature Reconstruction based on Non-Treering Proxy Data. 18 New Papers Link High Solar Activity To Medieval And Modern Warmth, Low Solar Activity To Little Ice Age Cooling. “It is generally accepted that the climate warms during periods of strong solar activity (e.g., the Medieval Warm Period) and cools during periods of low solar activity (e.g., the Little Ice Age).”
—Lyu et al., 2016 Within the last 1,000 years, global-scale surface temperatures underwent a warm period during Medieval times, centennial-scale cooling during the 14th to 19th centuries, and another warm period since the early 20th century. Climate Discussion Nexus. An intriguing new paper in the Journal of Marine Biology and Aquascape challenges conventional wisdom based on photographic and archaeological indicators of tropical sea levels.
Instead of rising gently for hundreds of years until a 20th-century man-made acceleration, they were similar to the present 850 years ago, then rose instead of falling during the Little Ice Age, up to 50 centimeters in many places by the 1600s, then retreated to their current, relatively stable levels. Medieval Warm Period Project. Medieval Warm Period Project Project Overview Study Description and Results Africa Antarctica Asia Australia/New Zealand Europe North America Northern Hemisphere Oceans South America MWP-CWP Quantitative Temperature Differentials MWP-CWP Qualitative Temperature Differentials Interactive Map and Time Domain Plot To view this feature, your computer must be configured to run applets that use Java technology.

List of Scientists Whose Work We Cite. Causation Of Climate Change: Was The Medieval Warm Period “Regional”? – Watts Up With That? Reposted from the MANHATTAN CONTRARIAN January 03, 2021 / Francis Menton Some commenters yesterday noted that the climate establishment has not just completely ignored the threat to their orthodoxy posed by the Medieval Warm Period and other similarly-warm pre-human-emissions eras.
Initially, there was recognition that this issue could be important, and there was definitely some attempt to deal with it. However, over time, the accumulation of evidence, particularly as to the existence Medieval Warm Period as a global phenomenon, gradually became overwhelming. Medieval Warm Period. New Study Shows Medieval Climate Period Was Global, Driven By Natural “Atmospheric-Ocean Cycles”, Not CO2. By Die kalte Sonne.
Medieval Warmth Was GLOBAL…Confirmed By Over 1200 Publications At Google Maps. More than 1200 publications show the Medieval Warm Period (MWP) was global – an embarrassment to global warming alarmists who claimed it was regional Global warming alarmist scientists like claiming that the well documented Medieval Warm Period (MWP) was mostly a regional, North Atlantic phenomenon, and was not global, and so we just move along and stop questioning man-made global warming.

For example, the online Britanica entry on the Medieval Warm Period written by John P. Rafferty writes that it occurred “predominantly in the Northern Hemisphere from Greenland eastward through Europe and parts of Asia.” Britanica does state that the claim of a global extent is highly controversial, though it really isn’t as we are about to see. Body Of Proof: Large Number Of Studies Show Medieval Warm Period “Prominent In Southern Hemisphere” Remember how in the late 1990s/early 2000s the Medieval Warm Period (MWP) was made to disappear, and it was claimed that it was mainly a local, North Atlantic phenomenon.
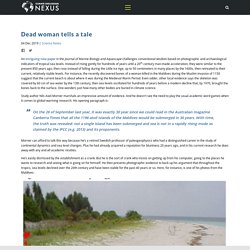
Unfortunately for those trumpeting this claim, a comprehensive worldwide survey of scientific literature is now showing that the MWP was in fact a global phenomenon, suggesting large-scale natural cycles are what is really driving the climate. . ================================= The Medieval Warm Period – a global phenomenon, unprecedented warming, or unprecedented data manipulation?
Originally in German here, with some portions translated to English using the Google translator below. Google translator is largely imperfect, but to read the Google translation in English go here. If anyone wishes to do a personal translation for the entire article, please leave a note in comments and I will replace it. Of great interest is the global graphic below, which shows that the MWP is a worldwide event, not just limited to portions of the Northern Hemisphere. “ “Who controls the past controls the future: who controls the present controls the past.” – George Orwell, 1984 We live in an age of superlatives. Naturally, also the reporting on climate change must follow this trend. Documenting the Global Extent of the Medieval Warm Period. By Angus McFarlane Introduction In this article I pose the following questions: Was the Medieval Warm Period (MWP) a global event? Where the MWP temperatures higher than recent times? The reasons for asking these questions are that climate establishment have tried to sideline the MWP as a purely local North Atlantic event.
I attempt to answer these questions below. The Medieval Warm Period. The theory of Anthropogenic Global Warming (AGW) holds that the warming trend since the end of the Little Ice Age (LIA) is unnatural and therefore human caused by way of fossil fuel emissions. The fossil fuel argument becomes relevant because the end of the LIA coincides with the Industrial Revolution such that the whole of the current warming event has occurred “in the industrial economy” making it useful to describe the current warming as “since pre-industrial times”.Skeptics have argued that natural variability must be considered before the industrial economy is taken to be the cause of the recovery from the LIA because the timing of the glacial melt event in Europe (in particular the Colle Gnifetti) that is generally accepted as the marker between the LIA and the current warming period is controversial as described in related a post [LINK].
Hughes 1994: Hughes, Malcolm K., and Henry F. Diaz. “Was there a ‘Medieval Warm Period’, and if so, where and when?.” Like this: Like Loading...
MWP in Europe and Asia. MWP in Africa and the Middle East. MWP in South America. MWP in Australia and New Zealand. MWP in Antarctica. Medieval Climate Anomaly Now Confirmed In Southern Hemisphere On All Four Continents. The Hockey Sticks. When the IPCC 'disappeared' the Medieval Warm Period. Mann, Hayhoe try to erase the Medieval warm period.
Climate alarmists Michael Mann and Katharine Hayhoe have been caught using dubious, revisionist temperature data in their attempt, as one Climategate email author put it, to “deal a mortal blow” to the extensively documented Medieval Warm Period. Before climate change became a political issue, it was scientifically well-established that a significant global warming event occurred between approximately 900 AD and 1200 AD. For example, the United Nations Intergovernmental Panel on Climate Change (IPCC) First Assessment Report presented a temperature history and visual graph documenting that the Medieval Warm Period existed and that it brought temperatures at least as warm as today (at pg. 7).
Multiple peer-reviewed studies provided additional confirmation of the Medieval Warm Period. The warming climate of the Medieval Warm Period spurred abundant crop production, fewer extreme droughts and floods, growing human population, and improving living standards. James Taylor James M. Erasing The Medieval Warm Period. In 1981, NASA’s James Hansen showed a Medieval Warm Period – based on temperatures in Greenland, California and England. In 1981, NASA’s. Rise and Fall of the Modern Warming Spike. The first graph appeared in the IPCC 1990 First Assessment Report (FAR) credited to H.H.Lamb, first director of CRU-UEA.
Unscientific hockey sticks and hidden data. These maps and graphs make it clear just how brazenly unscientific the Hockey Stick is.