
Of yeast, ecology, and cancer. A physicist, a mathematician, and an economist walk into a bakery.
It sounds like the opening of a witty one-liner, but for Jeff Gore, the Latham Family Career Development Assistant Professor of Physics at MIT, it marks the beginning of a career. The beauty of data visualization - David McCandless. Previsualization. Previsualization (also known as pre-rendering, preview or wireframe windows) is a function to visualize complex scenes in a movie before filming.
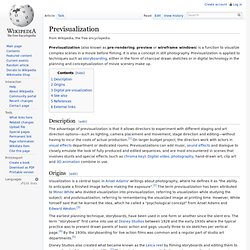
It is also a concept in still photography. Previsualization is applied to techniques such as storyboarding, either in the form of charcoal drawn sketches or in digital technology in the planning and conceptualization of movie scenery make up. Description[edit] The advantage of previsualization is that it allows directors to experiment with different staging and art direction options—such as lighting, camera placement and movement, stage direction and editing—without having to incur the costs of actual production.[1] On larger budget project, the directors work with actors in visual effects department or dedicated rooms. 50 Great Examples of Data Visualization. Wrapping your brain around data online can be challenging, especially when dealing with huge volumes of information.

And trying to find related content can also be difficult, depending on what data you’re looking for. But data visualizations can make all of that much easier, allowing you to see the concepts that you’re learning about in a more interesting, and often more useful manner. Below are 50 of the best data visualizations and tools for creating your own visualizations out there, covering everything from Digg activity to network connectivity to what’s currently happening on Twitter. Music, Movies and Other Media Narratives 2.0 visualizes music. R (programming language)
R is a programming language and software environment for statistical computing and graphics.
The R language is widely used among statisticians and data miners for developing statistical software[2][3] and data analysis.[3] Polls, surveys of data miners, and studies of scholarly literature databases show that R's popularity has increased substantially in recent years.[4][5][6][7] R is highly extensible through the use of user-submitted packages for specific functions or specific areas of study. Due to its S heritage, R has stronger object-oriented programming facilities than most statistical computing languages.
Extending R is also eased by its lexical scoping rules.[19] Another strength of R is static graphics, which can produce publication-quality graphs, including mathematical symbols. R has its own LaTeX-like documentation format, which is used to supply comprehensive documentation, both on-line in a number of formats and in hard copy. "useR! " How to Make an Interactive Network Visualization. Networks!
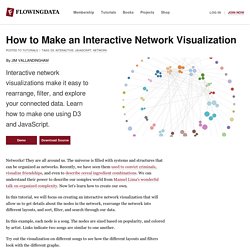
They are all around us. The universe is filled with systems and structures that can be organized as networks. Recently, we have seen them used to convict criminals, visualize friendships, and even to describe cereal ingredient combinations. Tutorials. Visualize This: The FlowingData Guide to Design, Visualization, and Statistics. About ET: Edward Tufte interviews, biography, contact information. Staggering excess. Business Insider calls this stacked bar chart "staggering" (link).
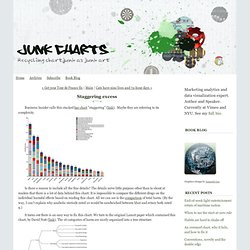
Maybe they are referring to its complexity. Scientists Say Infographics Can Save Morons From Themselves. Really? It’s a sad fact of our cultural moment that anyone can marshall their own "facts" to support just about any argument or political position imaginable.

(Thanks, Internet.) What’s worse, psychology studies have shown that rebutting factually impoverished arguments with actual facts has precisely the opposite effect one would hope: it actually makes people cling even tighter to their fictions. Is there anything that can cut through this Gordian knot of nonsense? According to researchers at Dartmouth College and Georgia State University, infographics might do the trick. Political scientists Brendan Nyhan and Jason Reifler designed some experiments to test the efficacy of graphical "correctives" to inaccurate beliefs. Why might this be? But there’s a big hole in this whole conceit. Here’s a simple example. Can someone please stop the infographic madness? A few years ago, we started doing info graphics by actually doing a lot of research on data and then working with a great group of guys to create art and visualization.
One of them was good enough to be linked from Apple’s website. Old magazine hands called these infographics, charticles. Wired and the old Red Herring were particularly good at this stuff. (No surprise, because my former editor and goddess of the charticle, Joanna Pearlstein works(worked) for both those publications.) USA Today, The New York Times and The Wall Street Journal, too had been creating these graphics for a long time, except they didn’t use them as a way to generate web-buzz.
What Exactly Is Visualization? I love a good visualization.
I’ve always been fascinated by those images that manage to inform and entertain at the same time. From time to time I’ve tried to supply tips and insight to help those interested in creating better visualizations. One morning while researching data visualizations I thought to myself “what really makes up visualization”, is it definable?
So I did what most of us do when we’re in search for information; I Googled it. Tutorials.