
Forecasting: principles and practice. AMSC689: Research Interaction Team in Penalized Regression (Fall 2013) Description Major advances in technology for genomic studies are bringing the prospect of personalized and individualized medicine closer to reality.
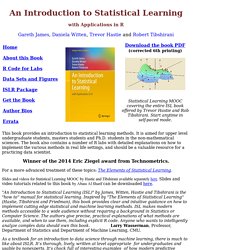
Many of these advances are predicated on the ability to generate data at an unprecedented rate, posing a significant need for computational data analysis that is clinically and biologically useful and robust. This reading course will concentrate on the fundamental statistical methods required to meet this need. Introduction to Statistical Learning. An Introduction to Statistical Learning with Applications in R Gareth James, Daniela Witten, Trevor Hastie and Robert Tibshirani This book provides an introduction to statistical learning methods.
Random forests - classification description. Contents Introduction Overview Features of random forests Remarks How Random Forests work The oob error estimate Variable importance Gini importance Interactions Proximities Scaling Prototypes Missing values for the training set Missing values for the test set Mislabeled cases Outliers Unsupervised learning Balancing prediction error Detecting novelties A case study - microarray data Classification mode Variable importance Using important variables Variable interactions Scaling the data Prototypes Outliers A case study - dna data Missing values in the training set Missing values in the test set Mislabeled cases Case Studies for unsupervised learning Clustering microarray data Clustering dna data Clustering glass data Clustering spectral data References Introduction This section gives a brief overview of random forests and some comments about the features of the method.
Overview. Model Training and Tuning. The caret package has several functions that attempt to streamline the model building and evaluation process.
The train function can be used to evaluate, using resampling, the effect of model tuning parameters on performance choose the "optimal" model across these parameters estimate model performance from a training set First, a specific model must be chosen. The caret Package. The caret package (short for Classification And REgression Training) is a set of functions that attempt to streamline the process for creating predictive models. The package contains tools for: data splittingpre-processingfeature selectionmodel tuning using resamplingvariable importance estimation as well as other functionality. There are many different modeling functions in R. How do I learn Machine Learning? Machine Learning Resources. Machine Learning. Statistics 36-350: Data Mining (Fall 2009) Cosma Shalizi Fall 2009 Important update, December 2011 If you are looking for the latest version of this class, it is 36-462, taught by Prof.
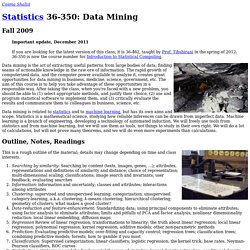
Tibshirani in the spring of 2012. 36-350 is now the course number for Introduction to Statistical Computing. Data mining is the art of extracting useful patterns from large bodies of data; finding seams of actionable knowledge in the raw ore of information. The rapid growth of computerized data, and the computer power available to analyze it, creates great opportunities for data mining in business, medicine, science, government, etc. OpenIntro. R - Generalized linear Models. 5 Generalized Linear Models Generalized linear models are just as easy to fit in R as ordinary linear model.
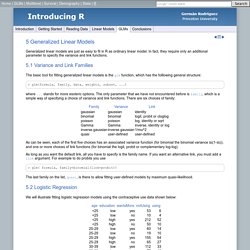
In fact, they require only an additional parameter to specify the variance and link functions. 5.1 Variance and Link Families The basic tool for fitting generalized linear models is the glm function, which has the folllowing general structure: GitHub Flavored Markdown - User Documentation. GitHub uses "GitHub Flavored Markdown," or GFM, across the site--in issues, comments, and pull requests.
It differs from standard Markdown (SM) in a few significant ways, and adds some additional functionality. If you're not already familiar with Markdown, take a look at Markdown Basics. If you'd like to know more about features that are available in issues, comments, and pull request descriptions, such as task lists, read Writing on GitHub. Differences from traditional Markdown. Markdown Basics. Getting the Gist of Markdown’s Formatting Syntax This page offers a brief overview of what it’s like to use Markdown.

The syntax page provides complete, detailed documentation for every feature, but Markdown should be very easy to pick up simply by looking at a few examples of it in action. The examples on this page are written in a before/after style, showing example syntax and the HTML output produced by Markdown. It’s also helpful to simply try Markdown out; the Dingus is a web application that allows you type your own Markdown-formatted text and translate it to XHTML. Note: This document is itself written using Markdown; you can see the source for it by adding ‘.text’ to the URL. Data Science Specialization. Managing a statistical analysis project – guidelines and best practices.
In the past two years, a growing community of R users (and statisticians in general) have been participating in two major Question-and-Answer websites: In that time, several long (and fascinating) discussion threads where started, reflecting on tips and best practices for managing a statistical analysis project.
They are: On the last thread in the list, the user chl, has started with trying to compile all the tips and suggestions together. The Duke Saga Starter Set. Courses/05_ReproducibleResearch at master · rdpeng/courses. Determining the number of clusters in a data set. Determining the number of clusters in a data set, a quantity often labeled k as in the k-means algorithm, is a frequent problem in data clustering, and is a distinct issue from the process of actually solving the clustering problem.
For a certain class of clustering algorithms (in particular k-means, k-medoids and Expectation-maximization algorithm), there is a parameter commonly referred to as k that specifies the number of clusters to detect. Other algorithms such as DBSCAN and OPTICS algorithm do not require the specification of this parameter; hierarchical clustering avoids the problem altogether. The correct choice of k is often ambiguous, with interpretations depending on the shape and scale of the distribution of points in a data set and the desired clustering resolution of the user. Rule of thumb[edit] Statistics for Genomcs: Distances and Clustering. Cooperation between Referees and Authors Increases Peer Review Accuracy.
Peer review is fundamentally a cooperative process between scientists in a community who agree to review each other's work in an unbiased fashion. Peer review is the foundation for decisions concerning publication in journals, awarding of grants, and academic promotion. Here we perform a laboratory study of open and closed peer review based on an online game. We show that when reviewer behavior was made public under open review, reviewers were rewarded for refereeing and formed significantly more cooperative interactions (13% increase in cooperation, P = 0.018). Json-mapping.pdf. XML.pdf. Tour.pdf. ShortIntro.pdf. XLConnect.pdf. Genolini-RBonnesPratiques.pdf. Statistics and the Science Club. One of my favorite movies is Woody Allen’s Annie Hall. If you’re my age and you haven’t seen it, I usually tell people it’s like When Harry Met Sally, except really good.
The movie opens with Woody Allen’s character Alvy Singer explaining that he would “never want to belong to any club that would have someone like me for a member”, a quotation he attributes to Groucho Marx (or Freud). Last week I posted a link to ASA President Robert Rodriguez’s column in Amstat News about big data. In the post I asked what was wrong with the column and there were a few good comments from readers. In particular, Alex wrote: When discussing what statisticians need to learn, he focuses on technological changes (distributed computing, Hadoop, etc.) and the use of unstructured text data. Dan Meyer: Math class needs a makeover. The key word in “Data Science” is not Data, it is Science.
One of my colleagues was just at a conference where they saw a presentation about using data to solve a problem where data had previously not been abundant. The speaker claimed the data were "big data" and a question from the audience was: "Well, that isn't really big data is it, it is only X Gigabytes". While that exact question would elicit groans from most people who work with data, I think it highlights one of the key problems with the thinking around data science.
Zero Intelligence Agents — Drew Conway. This happens to be one of those rare instances where the benefit of hindsight does not make me regret something said flippantly on a panel. I deeply believe that in order to truly change the world we cannot simply "throw analytics at the problem. " In Head-Hunting, Big Data May Not Be Such a Big Deal. Cross Validated. CRAN Task Views. Hilarymason.com. Junk Charts.
Data Visualization, Infographics, and Statistics. Statistics Blogs @ StatsBlogs.com. Normal Deviate. Statistical Modeling, Causal Inference, and Social Science « Statistical Modeling, Causal Inference, and Social Science. Statistics and the Science Club. ADAfaEPoV. Simulation.dvi - simulation_handout.pdf. Untitled - MPadilla_07.pdf. The importance of simulating the extremes. Simulation is commonly used by statisticians/data analysts to: (1) estimate variability/improve predictors , (2) to evaluate the space of potential outcomes , and (3) to evaluate the properties of new algorithms or procedures. Over the last couple of days, discussions of simulation have popped up in a couple of different places. First, the reviewers of a paper that my student is working on had asked a question about the behavior of the method in different conditions.
I mentioned in passing, that I thought it was a good idea to simulate some cases where our method will definitely break down. I also saw this post by John Cook about simple/complex models. Technical Methods Report: Guidelines for Multiple Testing in Impact Evaluations - Appendix B: Introduction to Multiple Testing. This appendix introduces the hypothesis testing framework for this report, the multiple testing problem, statistical methods to adjust for multiplicity, and some concerns that have been raised about these solutions. The goal is to provide an intuitive, nontechnical discussion of key issues related to this complex topic to help education researchers apply the guidelines presented in the report.
A comprehensive review of the extensive literature in this area is beyond the scope of this introductory discussion. Statistical significance for genomewide studies. Author Affiliations. Bayesian Model Averaging Home Page. Bayesian Model Averaging Home Page. AdaBoost. While every learning algorithm will tend to suit some problem types better than others, and will typically have many different parameters and configurations to be adjusted before achieving optimal performance on a dataset, AdaBoost (with decision trees as the weak learners) is often referred to as the best out-of-the-box classifier. When used with decision tree learning, information gathered at each stage of the AdaBoost algorithm about the relative 'hardness' of each training sample is fed into the tree growing algorithm such that later trees tend to focus on harder to classify examples.
Bootstrap aggregating. Random forest. Random forests - classification description. Bootstrapping. Nonparametric Bootstrapping The boot package provides extensive facilities for bootstrapping and related resampling methods. Getting started with the `boot' package in R for bootstrap inference. Lecture12.dvi - lecture12.pdf. ADAfaEPoV. Section-09.pdf. Section-06.pdf. Smoothing.pdf. Lecture-22. Untitled. Trees.pdf. Package boot. CvTools.pdf. Microsoft Word - CrossValidation1_JDS_May2011.docx - CrossValidation1_JDS_May2011.pdf. Practical machine learning: methods and algorithmics. Cohen's kappa. Peter Norvig - The Unreasonable Effectiveness of Data. Elements of Statistical Learning: data mining, inference, and prediction. 2nd Edition.
Lars. Regression Models for Count Data in R - countreg. Log Linear Analysis. Main - oiStat2_08.pdf. Lecture 24 - lecture24.pdf. Lecture 23 - lecture23.pdf. R - Generalized linear Models. Data Visualization, Infographics, and Statistics. Erreur de chargement de la page. R news & tutorials from the web. 14-reg-exp. Lecture 3. Tidy-data-pres.pdf. Gapminder: Unveiling the beauty of statistics for a fact based world view.
Données publiques / Open Data. Tidy data - tidy-data.pdf. ProjectTemplate. The Duke Saga Starter Set. Twotorials by anthony damico. R code style guide. OpenIntro. ADAfaEPoV. Short-refcard. Cross Validated. Stack Overflow. Stack Overflow. Google's R Style Guide.