
Weave (Web-based Analysis and Visualization Environment) Data Visualization Software. JuiceKit for Visual Analytics - JuiceKit™ SDK. Free Dashboard Software. GGobi data visualization system. Gephi, an open source graph visualization and manipulation software. Online Charts Builder.
Tutorials. How to Make a State Grid Map in R Something of a cross between a reference table and a map, the state grid provides equal space to each state and a semblance of the country to quickly pick out individual states.

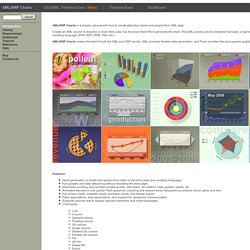
How to Make Animated Line Charts in R Sometimes it's useful to animate the multiple lines instead of showing them all at once. How to Make a Multi-line Step Chart in R For the times your data represents immediate changes in value. Microsoft SQL Server Gets a Big Data Revamp - databasejournal.com - Data Visualization Tools. Software: Visualization and Data Mining. gRaphaël—Charting JavaScript Library. Highcharts - Interactive JavaScript charts for your webpage. 5 Top jQuery Chart Libraries for Interactive Charts. A PHP Charting library. SWF Charts > Introduction. XML/SWF Charts is a simple, yet powerful tool to create attractive charts and graphs from XML data.

Create an XML source to describe a chart, then pass it to this tool's flash file to generate the chart. The XML source can be prepared manually, or generated dynamically using any scripting language (PHP, ASP, CFML, Perl, etc.) XML/SWF Charts makes the best of both the XML and SWF worlds. Charts library.