Clackamas River - Steelhead University. The Clackamas River has a special place in my heart.
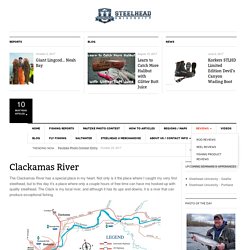
Not only is it the place where I caught my very first steelhead, but to this day it’s a place where only a couple hours of free time can have me hooked-up with quality steelhead. The Clack is my local river, and although it has its ups and downs, it is a river that can produce exceptional fishing. MT HOOD TEST SITE SNOTEL Data. Mazamas: GLACIER REPHOTO DATABASE: MOUNT HOOD. In 2012, supported by funding from a Mazamas research grant, PSU geologist Hassan Basagic visited numerous mountains in the Pacific Northwest in order to duplicate glacier photographs originally recorded early in the 20th century.
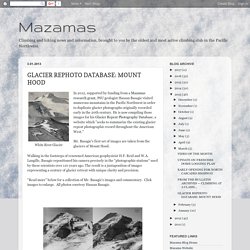
He is now compiling those images for his Glacier Repeat Photography Database, a website which "seeks to summarize the existing glacier repeat photographic record throughout the American West. " Mr. Basagic's first set of images are taken from the glaciers of Mount Hood. Keith M Jackson's personal webpage. Repeat Photos Left image taken July 23, 1901 by H.F.
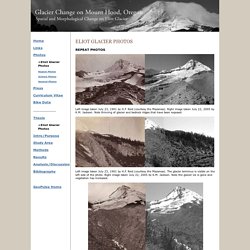
Reid (courtesy the Mazamas). Right image taken July 22, 2005 by K.M. Jackson. Cliff Mass Weather Blog: Will the Pacific Northwest be a Climate Refuge Under Global Warming? As global warming takes hold later in the century, where will be the best place in the lower 48 states to escape its worst effects?
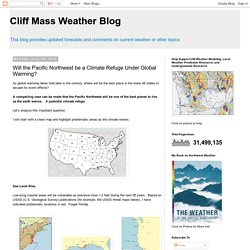
A compelling case can be made that the Pacific Northwest will be one of the best places to live as the earth warms. A potential climate refuge. Let's analyze this important question. I will start with a clean map and highlight problematic areas as the climate warms. Sea Level Rise. Climate Change Indicators in the United States. Key Points During the past 75 years, seven-day low flows have generally increased in the Northeast and Midwest (in other words, on the days of lowest flows, streams in these areas are carrying more water than before).
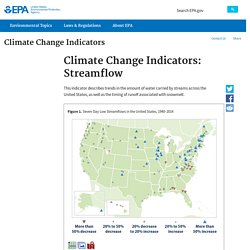
Low flows have generally decreased in parts of the Southeast and the Pacific Northwest (that is, streams are carrying less water than before). Estuaries and large river deltas in the Pacific Northwest: Climate Change Impacts to the US Pacific and Arctic Coasts Project. Typical wetland in Puget Sound that now faces “squeeze” as rising sea level meets human infrastructure.
Photo by Guy Gelfenbaum, USGS. Water supply and flood control can be controversial issues in large river systems like the Skagit River delta in the Puget Sound area of Washington State. The challenge can be getting all of the separate interests to the table—farmers, ecosystem restoration practitioners, tribal communities, and dozens of land-use managers. During town hall-style meetings where communities voiced their concerns, USGS geologist Eric Grossman informed them about the science of climate change and its impacts in the region. He’s watched a room of apprehensive residents, regional managers, and other stakeholders grow to a full house in a few years. Northwest. ©Macduff Everton/Corbis With diverse landforms (such as beaches, rocky shorelines, bluffs, and estuaries), coastal and marine ecosystems, and human uses (such as rural communities, dense urban areas, international ports, and transportation), the Northwest coast will experience a wide range of climate impacts.
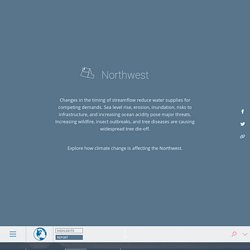
Description of Observed and Projected Changes Global sea levels have risen about 8 inches since 1880 and are projected to rise another 1 to 4 feet by 2100 (Ch. 2: Our Changing Climate, Key Message 10). Glory satellite to study aerosols' effect on climate (w/ Video) (PhysOrg.com) -- Earth’s climate continues to change at a rapid pace.
Last week, NASA announced that 2010 was tied as the warmest year on record. Likewise, the last decade was the warmest in the 130-year global temperature record maintained by scientists at NASA’s Goddard Institute for Space Studies (GISS) in New York City. Meanwhile, at Vandenberg Air Force Base in California, engineers are preparing NASA’s next Earth-observing mission -- a satellite called Glory -- for launch in late February. The satellite, which contains two instruments that will monitor key parts of the climate system, aims to offer a new stream of data that climatologists will use as part of an ongoing effort to improve the accuracy of climate models. The Aerosol Polarimetry Sensor (APS), a science instrument mounted on the Earth-facing side of the spacecraft, will collect information about small airborne particles called aerosols that can affect climate by absorbing and scattering light.
What Happens If All The World's Ice Melts? - Seeker - Video. Related on TestTube:Which Countries Will Be Underwater Due To Climate Change?
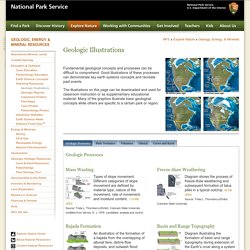
What's the Difference Between Global Warming and Climate Change? What would happen if all the ice on Earth melted? Exploring Earth Visualizations. Observe river erosion creating waterfalls and chasms. Explore Nature » Geologic Resources » Education. Plate Tectonics Fault Types Learn what the different fault types are and what the difference between the Hanging Wall and Foot Wall in these illustrations. 310 KB JPEG Source: Trista L.
Mass Movements & Wind Erosion Videos by Lubin Labs on Prezi. NPS: Explore Nature » Geologic Resources » Education. KS3 Bitesize Geography - Rivers and flooding : Revision, Page 6. Ten Things You Need to Know About the Volcano in Your Backyard. USGS Data Series 906: Database for the preliminary geologic map of the Mount Hood 30- by 60-minutes quadrangle, northern Cascade Range, Oregon. Abstract The Mount Hood 30- by 60-minute quadrangle covers the axis and east flank of the Cascade Range in northern Oregon. Its namesake, Mount Hood volcano, dominates the view in the northwest quarter of the quadrangle, but the entire area is underlain by Oligocene and younger volcanic and volcaniclastic rocks of the Cascade Range. NGMDB Product Description Page. Title:Database for the preliminary geologic map of the Mount Hood 30- by 60-minute quadrangle, northern Cascade Range, OregonAuthor(s): Ma, Lina, Sherrod, D.R., and Scott, W.E.Publishing Organization: U.S.
Geological SurveySeries and Number: Data Series DS-906Publication Date: 2014Map Scale: 1:100,000Cross Section: NoneNorth Latitude: 45° 30' 0" N (45.5000)South Latitude: 45° 0' 0" N (45.0000)East Longitude: 121° 0' 0" W (-121.0000)West Longitude: 122° 0' 0" W (-122.0000) Click image to view Select an image and choose a download option Google Earth KMZ (unavailable) NOTE: Images shown may not constitute the entirepublication -- see Availability section above. OFR2007-1222, Digital Data for Volcano Hazards of the Mount Hood Region, Oregon. U.S. Geological Survey Open-File Report 2007-1222 Version 1.0. Pacific Northwest Geologic Mapping and Urban Hazards. Pacific Northwest Geologic Mapping and Urban Hazards.
Mineralogy Database. Lithology Key Related Keywords & Suggestions - Lithology Key Long Tail Keywords. Writing a Geological Report - UNSW GEOSOC. Maps and Imagery - dancoe. Maps and Imagery - dancoe. Maps and Imagery - dancoe. Reducing risk from lahar hazards: concepts, case studies, and roles for scientists. Each of the four basic risk-reduction strategies of hazard avoidance, hazard modification, hazard warning, and hazard response and recovery (Figure 2) has basic underlying requirements for successful application.
These requirements include an accurate assessment of the hazard; a realistic understanding by elected officials, emergency managers, and at-risk populations of the hazards, risks, and limitations of any implemented strategy; thorough planning; adequate funding; practice exercises and drills, where appropriate; and effective communication among stakeholders during actual lahar occurrence (Mileti [1999]; Leonard et al. [2008]). Oregon Explorer Map Viewer. Institute for Natural Resources. Interactive Mapping Oregon Explorer Oregon Explorer Map Viewer With hundreds of map layers available to draw from, you can use the Oregon Explorer Map Viewer to make your own custom map and share it with others.
If you need guidance, watch tutorials on how to use the Oregon Explorer Map Viewer. Downloadable Maps Land Ownership Land Ownership, Management, and Protected Areas. Western Geographic Science Center. WR Geography. Science Application for Risk Reduction (SAFRR) The Science Application for Risk Reductioon (SAFRR) estimates consequences of natural hazard disaster scenarios as a strategy to increase community resiliency, a community’s ability to cope with the effects of a disaster. Volcanology and Geothermal Energy. Introduction to characterisation: Multi-scale Hierarchical Framework - REFORM wiki. 1(c). Scope of Physical Geography. Geography Strategy - Geomorphology Syllabus for UPSC & IAS Exam - IASbaba Geomorph_intro.
Glaciers of the American West. ES 331/767 Lecture 3.