
Earth Polychromatic Camera. 21 Essential Data Visualization Tools. We have collected leading data visualization tools, with a short overview of each tool, its strong and weak points.
By Piotr Kuzniewicz, (Usability Tools). They say a picture is worth a thousand words—but in online world, a chart or infographic will enrich any designers repertoire. If you are focused on having a clear insight into your numbers, then you know what your business needs: Data Visualization. Let me introduce you to the article in which you will find 21 Data Visualization tools that are essential for your website. Canva Canva makes design simple for everyone. D3.js D3.js is an abbreviation for ‘Data Driven Documents’. Datawrapper Datawrapper allows you to create charts and maps in four steps.
Dipity Dipity is another timeline-creating tools that is useful to organize your web’s content by date and time. Dygraphs Dygraphs is a fast, flexible open source JavaScript charting library that allows users to explore and interpret dense data sets. Excel. Netlytic.org. Treemaps for space-constrained visualization of hierarchies. Started Dec. 26th, 1998 by Later updates by Ben Shneiderman and Catherine Plaisant - Last update Sept 2014 Our treemap products: Treemap 4.0: General treemap tool (Free demo version, plus licensing information for full package) PhotoMesa: Zoomable image library browser (Free demo version, plus licensing information for full package) Treemap Algorithms and Algorithm Animations (Open source Java code) A History of Treemap Research at the During 1990, in response to the common problem of a filled hard disk, I became obsessed with the idea of producing a compact visualization of directory tree structures.
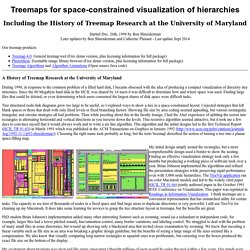
Since the 80 Megabyte hard disk in the HCIL was shared by 14 users it was difficult to determine how and where space was used. Tree structured node-link diagrams grew too large to be useful, so I explored ways to show a tree in a space-constrained layout. My initial design simply nested the rectangles, but a more comprehensible design used a border to show the nesting. 15 Effective Tools for Visual Knowledge Management. Since I started my quest a few years ago searching for the ultimate knowledge management tool, I’ve discovered a number of interesting applications that help people efficiently organize information.
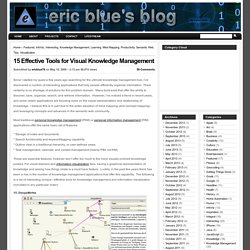
There certainly is no shortage of solutions for this problem domain. Many tools exist that offer the ability to discover, save, organize, search, and retrieve information. However, I’ve noticed a trend in recent years, and some newer applications are focusing more on the visual representation and relationship of knowledge. I believe this is in part due to the wider adoption of mind mapping (and concept mapping), and leveraging concepts and advances in the semantic web community. Most traditional personal knowledge management (PKM) or personal information management (PIM) applications offer the same basic set of features: These are essential features, however don’t offer too much to the more visually-inclined knowledge junkies. 15. Link: Platforms: Win, Mac, Linux Cost: Free (Open Source) Peoplemovin - A visualization of migration flows.
World Population: 6,853,328,460 Migrants in the world: 215,738,321 Almost 216 million people, or 3.15% of the world population, live outside their countries.
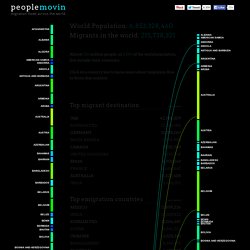
Click on a country box to know more about migration flow to/from that country. About peoplemovin peoplemovin shows the flows of migrants based on the last data available on International Migrant Stock. International migrant stock is the number of people born in a country other than that in which they live. The data are presented as a slopegraph that shows the connections between countries. Refugees and Asylum Refugees and asylum seekers made up 16.3 million, or 8%, of international migrants in 2010. Data Sources. Cognitive Mapping. Definitions, Examples, and Resources November 2002.
Updated: 16 May 2004; 12 April 2005; 27 March 2006; 20 September 2006; 25 March 2007; 5 November 2008; 29 January 2011. Last Update and Link Check: 7 December 2011. First published at Intraspec.ca. Moved here, reformatted, with minor updates, 16 June 2013. Definition of Cognitive Mapping Cognitive mapping may be defined as. Tools - WikiViz. yWorks - The Diagramming Company. The Diagramming Company. Adam Magyar - Stainless, 42 Street (excerpt) 100 Diagrams That Changed the World.
Since the dawn of recorded history, we’ve been using visual depictions to map the Earth, order the heavens, make sense of time, dissect the human body, organize the natural world, perform music, and even concretize abstract concepts like consciousness and love. 100 Diagrams That Changed the World (public library) by investigative journalist and documentarian Scott Christianson chronicles the history of our evolving understanding of the world through humanity’s most groundbreaking sketches, illustrations, and drawings, ranging from cave paintings to The Rosetta Stone to Moses Harris’s color wheel to Tim Berners-Lee’s flowchart for a “mesh” information management system, the original blueprint for the world wide web.
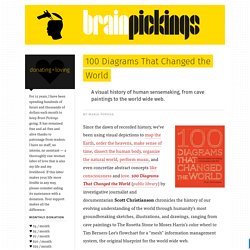
It appears that no great diagram is solely authored by its creator. Most of those described here were the culmination of centuries of accumulated knowledge. Most arose from collaboration (and oftentimes in competition) with others.