
Visualizing Algorithms. Turtle Graphics. David McCandless: The beauty of data visualization. Kuchen für alle! 15 hilfreiche Tools für die Datenvisualisierung. Chart Gallery - Google Charts. Online Python Tutor - Learn programming by visualizing code execution. jStat Documentation.
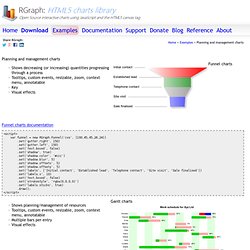
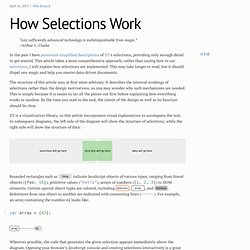
Formstone · Front-End Components. HTML5 JavaScript dynamic client side data visualization. Highcharts - Interactive JavaScript charts for your webpage. Planning and management charts. Share RGraph: Planning and management charts Funnel charts Shows decreasing (or increasing) quantities progressing through a process Tooltips, custom events, resizable, zoom, context menu, annotatable Key Visual effects.
HTML5 UP! Responsive HTML5 and CSS3 Site Templates. Text input love. HTML5 Showcase for Web Developers: The Wow and the How. Webkit If using Google Chrome, you will likely need the Dev channel to see all of the functionality in this presentation.

If you are using Safari, you will likely need a nightly build of WebKit in order to see all of the functionality in this presentation. Mozilla You are running a Mozilla browser. While such browsers generally have excellent support for HTML5 features, this presentation has only been tested using WebKit browsers such as Google Chrome or Safari. Other browser You are running a browser that has not been tested with this presentation. WebGL: available WebGL: not supported. Hakimel/reveal.js. How Selections Work.
Any sufficiently advanced technology is indistinguishable from magic.
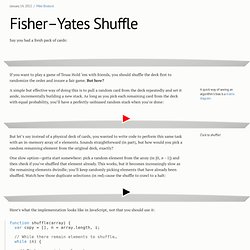
–Arthur C. Clarke In the past I have presented simplified descriptions of D3’s selections, providing only enough detail to get started. This article takes a more comprehensive approach; rather than saying how to use selections, I will explain how selections are implemented. This may take longer to read, but it should dispel any magic and help you master data-driven documents. The structure of this article may at first seem arbitrary. D3 is a visualization library, so this article incorporates visual explanations to accompany the text. Var array = [42]; Wherever possible, the code that generates the given selection appears immediately above the diagram. Mike Bostock. December 27, 2014Mapping Every Path to the N.F.L.

Playoffs December 20, 2014How Each Team Can Make the N.F.L. Playoffs November 5, 2014The Most Detailed Maps You’ll See From the Midterm Elections November 3, 2014How To Scroll September 19, 2014‘Stop-and-Frisk’ Is All but Gone From New York July 26, 2014Mapping the Spread of Drought Across the U.S. June 26, 2014Visualizing Algorithms June 15, 2014Three Little Circles. Fisher–Yates Shuffle. Say you had a fresh pack of cards: If you want to play a game of Texas Hold ‘em with friends, you should shuffle the deck first to randomize the order and insure a fair game.
But how? A simple but effective way of doing this is to pull a random card from the deck repeatedly and set it aside, incrementally building a new stack. As long as you pick each remaining card from the deck with equal probability, you’ll have a perfectly-unbiased random stack when you’re done: But let’s say instead of a physical deck of cards, you wanted to write code to perform this same task with an in-memory array of n elements. One slow option—gotta start somewhere: pick a random element from the array (in [0, n - 1]) and then check if you’ve shuffled that element already.
Here’s what the implementation looks like in JavaScript, not that you should use it: Web Designer. Vega: A Visualization Grammar. Crossfilter. Fast Multidimensional Filtering for Coordinated Views Crossfilter is a JavaScript library for exploring large multivariate datasets in the browser.
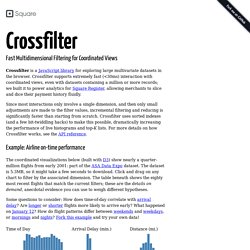
Crossfilter supports extremely fast (<30ms) interaction with coordinated views, even with datasets containing a million or more records; we built it to power analytics for Square Register, allowing merchants to slice and dice their payment history fluidly. Since most interactions only involve a single dimension, and then only small adjustments are made to the filter values, incremental filtering and reducing is significantly faster than starting from scratch.
Crossfilter uses sorted indexes (and a few bit-twiddling hacks) to make this possible, dramatically increasing the performance of live histograms and top-K lists. For more details on how Crossfilter works, see the API reference. Infographics & Data Visualization. Data Visualization, Infographics, and Statistics. 7 Interactive Resumes That Shame Your Paper Version. In the wild, animals competing for the same thing scare off the competition with grand displays of dominance.
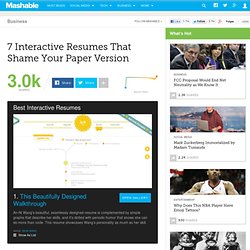
The same goes for your job search. We're not saying you should wear a fluorescent suit to an interview or pee on the interviewer's shoes, but the right amount of showiness can go a long way in the business world, starting with your resume. An interactive resume gives you more control over your first impression, showcasing who you are instead of just what you've done. These seven job-seekers have done an excellent job of putting their personality and creativity first when it comes to showing themselves off to potential employers.
Find some inspiration from these go-getters, and then get to work sprucing up your own resume or CV, 'cause it's a jungle out there. Datendesign mit R / 100 Visualisierungsbeispiele. Please do not quote without permission!