
Visual Capitalist. 10 stunning images show the beauty hidden in pi. Best of the Web: February 2019. The Lives of 10 Famous Painters, Visualized as Minimalist Infographic Biographies. By Maria Popova For their latest masterpiece, my friend Giorgia Lupi and her team at Accurat — who have previously given us such gems as a timeline of the future based on famous fiction, a visualization of global brain drain, and visual histories of the Nobel Prize and the 100 geniuses of language — have teamed up with illustrator Michela Buttignol to visualize the lives of ten famous painters, using the visual metaphors of painting and the specific stylistic preferences — shapes, colors, proportions — of each artist.
Each visual biography depicts key biographical moments — births, deaths, love affairs, marriages, birth of children, travel — as well as notable and curious features like handedness (mostly righties, with the exception of Klee), astrological sign, and connections. For a closer look, click each image to view the full-size version: Visualizing painters’ lives series.
Data visualisation: how Alberto Cairo creates a functional art. It's not enough for visualisations to string the correct numbers together, they should - in the words of William Morris - be beautiful and useful.
And one of the leading experts in making data beautiful is Alberto Cairo - who teaches information graphics and visualisation at the University of Miami's School of Communication. His latest book, The Functional Art, is a comprehensive guide not only to how to do it; but how to get it right, too. And, if you're interested in data visualisation, you must not only read this but absorb each of the lessons he teaches so patiently. It's worth checking out, even if producing charts is not your day job. Cairo explains patiently why a bar chart is superior to a bubble chart, for example, or how to use colour. Cairo is not a big fan of circles - and gives numerous reasons why: "you want readers to compare areas, but they tend to compare heights".
It comes with a DVD - which is worth watching for an analysis of Guardian America's gay rights interactive. Tree visualization to represent texting interactions. This site publishes high-touch, time-intensive data visualizations (and has a business that sustains it) Over 7,000 artists played in the New York City area in 2013.
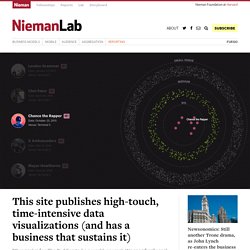
Only 21 of those later made it, really made it, headlining at a venue with an over 3,000-person capacity — among them, bigger names like Chance the Rapper, X Ambassadors, Sam Smith, and Sylvan Esso. I learned this sort of random but fascinating tidbit from a data visualization titled “The Unlikely Odds of Making it Big,” from the site The Pudding. The Pudding is the home to high-touch, painstakingly crafted data visualizations — what the site calls “visual essays” — that are distinct in their obsessive complexity over points of cultural curiosity. Most pieces stand wholly apart from the U.S. news cycle; no anxiety-inducing interactives around budget, taxes, health care. Want to see everywhere jazz legend Miles Davis is mentioned across Wikipedia, and how he’s connected to other people, recordings, and places?
“We’re all over the map. Our story backlog is now totally open again. Best Information Time Graphics Table Mitchell images on Designspiration. Human Data Interactions. Infographed. OneZoom Tree of Life Explorer.
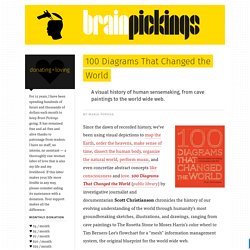
A Gorgeous—and Unsettling—Video of Evolution in Action. 100 Diagrams That Changed the World. Since the dawn of recorded history, we’ve been using visual depictions to map the Earth, order the heavens, make sense of time, dissect the human body, organize the natural world, perform music, and even concretize abstract concepts like consciousness and love. 100 Diagrams That Changed the World (public library) by investigative journalist and documentarian Scott Christianson chronicles the history of our evolving understanding of the world through humanity’s most groundbreaking sketches, illustrations, and drawings, ranging from cave paintings to The Rosetta Stone to Moses Harris’s color wheel to Tim Berners-Lee’s flowchart for a “mesh” information management system, the original blueprint for the world wide web.
It appears that no great diagram is solely authored by its creator. Most of those described here were the culmination of centuries of accumulated knowledge. Most arose from collaboration (and oftentimes in competition) with others. Christianson offers a definition: Are You In The Majority Of Everything? Check This Handy Chart. Mapped historical photos from collections large and small. DataArt - Visualisations. Top Colors of year 2010 – infographic. 50 Great Examples of Data Visualization.
Wrapping your brain around data online can be challenging, especially when dealing with huge volumes of information.

And trying to find related content can also be difficult, depending on what data you’re looking for. But data visualizations can make all of that much easier, allowing you to see the concepts that you’re learning about in a more interesting, and often more useful manner. Below are 50 of the best data visualizations and tools for creating your own visualizations out there, covering everything from Digg activity to network connectivity to what’s currently happening on Twitter.
Music, Movies and Other Media Narratives 2.0 visualizes music. Liveplasma is a music and movie visualization app that aims to help you discover other musicians or movies you might enjoy. Tuneglue is another music visualization service. MusicMap is similar to TuneGlue in its interface, but seems slightly more intuitive. 15 Stunning Examples of Data Visualization. Data Visualization is a method of presenting information in a graphical form.

Good data visualization should appear as if it is a work of art. This intrigues the viewer and draws them in so that they can further investigate the data and info that the graphic represents. In this post there are 15 stunning examples of Data Visualization that are true works of art. Click on the title or image for a larger view of each visualization. The Strengths of Nations Here’s an image that discusses the variations in how different nations pursue science.
Madrid.Citymurmur CityMurmur tries to understand and visualize how media attention reshapes the urban space and city. Data Visualizations, Challenges, Community. A Beautiful Poster Packed With a Year of Global Weather Data. The Weather Radials poster is about as much meteorological data as you can cram onto a single sheet of paper.
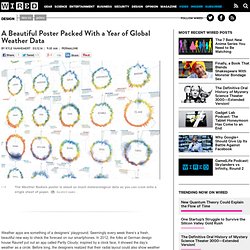
Raureif GmbH Each day of 2013 is represented by a single line. The Evolution of the Web.