
Juice Labs - Chart Chooser. Gapminder: Unveiling the beauty of statistics for a fact based world view. Presentation Designer. 10 Tips for Designing Infographics. Assuming you’re not working for a media corporation with huge graphics and statistics departments at your disposal, you may want to create some infographics for your own articles.
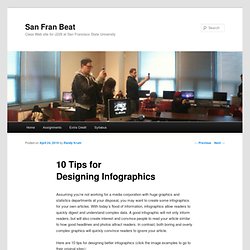
With today’s flood of information, infographics allow readers to quickly digest and understand complex data. A good infographic will not only inform readers, but will also create interest and convince people to read your article similar to how good headlines and photos attract readers. In contrast, both boring and overly complex graphics will quickly convince readers to ignore your article. Here are 10 tips for designing better infographics (click the image examples to go to their original sites): 1) Be Concise: Design your infographic to convey one idea really well. This example is an infographic poster I created about the caffeine content in drinks. The Caffeine Poster, by Randy Krum 2) Be Visual: Design your infographic with your final for viewing size in mind. Google PageRank Explained, by Elliance Like this:
TALKING NUMBERS WITH: EDWARD R. TUFTE; Campaigning For the Charts That Teach. EDWARD R.
TUFTE'S books have a certain austere elegance about them, starting with ''The Visual Display of Quantitative Information'' (1983), which sold hundreds of thousands of copies and made his reputation as a guru of information graphics. So when Professor Tufte was surfing Amazon.com recently for books about business graphics, he was perversely delighted with what he found. ''The titles are so wonderfully bad,'' he said one gray morning last month, sitting in the vast open kitchen of his low-slung house in the hills north of New Haven. He waved a hand at a stack of new books, their covers ablaze with rainbow-colored charts and sock-you-in-the-face titles like ''Power Pitches,'' ''Creating Cool PowerPoint 97 Presentations'' and ''Point, Click & Wow.'' Professor Tufte opened a book more or less at random to a chart with the headline ''U.S.
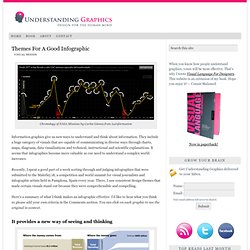
& Canada: Sales Growth %.'' ''This is a nice example of a very dopey graphic,'' he said. That view is hardly uncontroversial. A Periodic Table of Visualization Methods. Themes For A Good Infographic. Chronology of NASA Missions by Carlos Gámez from Lainformacion Information graphics give us new ways to understand and think about information.
They include a huge category of visuals that are capable of communicating in diverse ways through charts, maps, diagrams, data visualizations and technical, instructional and scientific explanations. It seems that infographics become more valuable as our need to understand a complex world increases. Recently, I spent a good part of a week sorting through and judging infographics that were submitted to the Malofiej 18, a competition and world summit for visual journalists and infographic artists held in Pamplona, Spain every year. There, I saw consistent design themes that made certain visuals stand out because they were comprehensible and compelling. Here’s a summary of what I think makes an infographic effective. It provides a new way of seeing and thinking The information tells a story The information is well-organized It works on multiple levels.