
Discover and personalize your news - Hubii. LocalFeed. A Time-Lapse Map of Every Nuclear Explosion Since 1945. Japanese artist Isao Hashimoto has created a beautiful, undeniably scary time-lapse map of the 2053 nuclear explosions which have taken place between 1945 and 1998, beginning with the Manhattan Project’s “Trinity” test near Los Alamos and concluding with Pakistan’s nuclear tests in May of 1998.
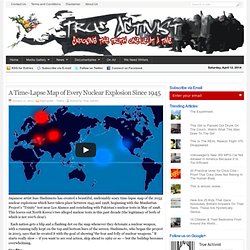
This leaves out North Korea’s two alleged nuclear tests in this past decade (the legitimacy of both of which is not 100% clear). Each nation gets a blip and a flashing dot on the map whenever they detonate a nuclear weapon, with a running tally kept on the top and bottom bars of the screen. Hashimoto, who began the project in 2003, says that he created it with the goal of showing”the fear and folly of nuclear weapons.” It starts really slow — if you want to see real action, skip ahead to 1962 or so — but the buildup becomes overwhelming. Credits:aConcernedHumanctbto.org. MetaMap. Accurat is an information design agency based in Milan and New York, founded by Giorgia Lupi, Simone Quadri and Gabriele Rossi in 2011.
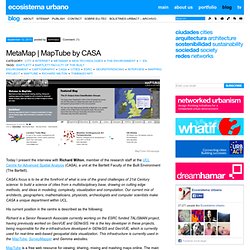
They define their work as the following: We envision and identify new ways to structure information, revealing and addressing latent needs, desires and opportunities. Basing our methods on the design thinking approach, we specialize in providing our clients with consultancies, services, and products related to information design. Focusing on how information is transforming networks, cultures, contexts, and behaviors is an attempt to understand the future, a demonstration that it can be intercepted and designed.
I interviewed them about Big Data base maps and about their ongoing work in mapping: ✳Urban Sensing. Experiment of Tweet mapping in Milan during design week 1. To us, mapping could be seen in a broader context as “structuring information”. We designed 2 tools at 2 different scales, the macro scale of the city and the micro scale of the neighborhood. Abkebab's Map of Europe 1000 AD to present with timeline. World map showing the countries with the highest numbers of people displaced through conflict. TweetMap ALPHA.
LA DOMESTICIDAD COMPARTIDA (pfc en proceso) Felix Pharand-Deschenes – Cartografiando el Antropoceno. Impresionantes y muy estéticas las imágenes realizadas por el científico canadiense Felix Pharand-Deschenes utilizando la información gráfica proporcionada por diferentes satélites, instituciones y agencias en un proyecto que ha denominado Una cartografía del Antropoceno.
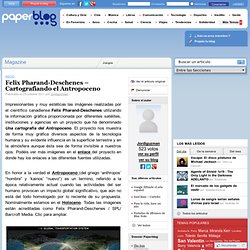
El proyecto nos muestra de forma muy gráfica diversos aspectos de la tecnología humana y su evidente influencia en la superficie terrestre y en la atmósfera aunque ésta sea de forma invisible a nuestros ojos. Podéis ver más imágenes en el enlace del proyecto en donde hay los enlaces a las diferentes fuentes utilizadas. En honor a la verdad el Antropoceno (del griego ‘anthropos’ “hombre” y ‘kainos’ “nuevo”) es un termino, referido a la época relativamente actual cuando las actividades del ser humano provocan un impacto global significativo, que aún no está del todo homologado por lo reciente de su propuesta. Nominalmente estamos en el Holoceno. Sistema de transporte global. Europa. Norteamérica. África. Europa. GunnMap 2. Panoramic images from all over the world: 360 degree pictures from 5 continents and 26 countries (fullscreen spherical panorama) Let's describe the whole world! PEER 1 Hosting Launches Map of the Internet App.
Wednesday, March 6, 2013 - 04:00 While curiosity around the Internet has loomed since its inception, no one has been able to explain what the Internet physically looks like.

Today, I’m excited to share that we have officially launched our Map of the Internet app, which provides a stunning 3D visualization of the Internet and all of its autonomous systems worldwide, as well as how they are connected. In 2011, we took the first step in developing this visualization with the debut of our Map of the Internet infographic poster. Driven by our continued passion for all things having to do with networking, we designed this app to further bring to life what the Internet looks like – and how the various autonomous components interact to connect the world. UPDATE: CNNMoney has posted a video review and demonstration of the app here. Users can view Internet service providers (ISPs), Internet exchange points, universities and other organizations through two view options – Globe and Network.
Credits. Tweet ping. The Internet map. SKY-MAP.ORG. Spain Startup Map - the map of the spanish startup community.