
Over 100 Incredible Infographic Tools and Resources (Categorized) This post is #6 in DailyTekk’s famous Top 100 series which explores the best startups, gadgets, apps, websites and services in a given category.

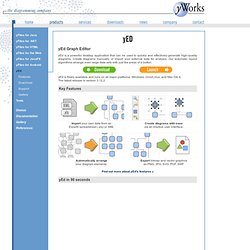
Total items listed: 112. Time to compile: 8+ hours. Follow @DailyTekk on Twitter to make sure you don’t miss a week! Update: Be sure to check out our latest post on infographics: Infographics Are Everywhere – Here’s How to Make Yours Go Viral. I love a good infographic! There’s more to this article! Infographics & Data Visualization. yEd - Graph Editor. yEd is a powerful desktop application that can be used to quickly and effectively generate high-quality diagrams.

Create diagrams manually, or import your external data for analysis. Our automatic layout algorithms arrange even large data sets with just the press of a button. yEd is freely available and runs on all major platforms: Windows, Unix/Linux, and Mac OS X. The latest release is version 3.12.2 Key Features Import your own data from an Excel® spreadsheet (.xls) or XML Create diagrams with easevia an intuitive user interface.
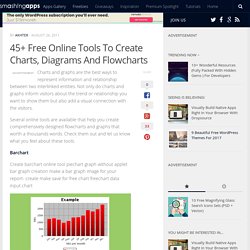
Automatically arrangeyour diagram elements. Export bitmap and vector graphicsas PNG, JPG, SVG, PDF, SWF yEd in 90 seconds Supported Diagrams yEd supports a wide variety of diagram types. Support Resources The yEd online support resources include the yEd Graph Editor manual and the yEd forum where you can give us feedback. 45+ Free Online Tools To Create Charts, Diagrams And Flowcharts. Charts and graphs are the best ways to represent information and relationship between two interlinked entities.

Not only do charts and graphs inform visitors about the trend or relationship you want to show them but also add a visual connection with the visitors. Several online tools are available that help you create comprehensively designed flowcharts and graphs that worth a thousands words. Check them out and let us know what you feel about these tools. Barchart Create barchart online tool piechart graph without applet bar graph creation make a bar graph image for your report- create make save for free chart freechart data input chart Cacoo Cacoo is a user-friendly online drawing tool that allows you to create a variety of diagrams such as site maps, wire frames, UML and network charts.
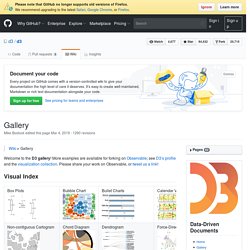
LucidChart With LucidChart you can you can create and publish customized flowcharts. Mindomo Bubbl Grapher Grapher is an online chart creater but only bar graph with limited features is available. Hohli Charts. Gallery · mbostock/d3 Wiki. Wiki ▸ Gallery Welcome to the D3 gallery!

More examples are available for forking on Observable; see D3’s profile and the visualization collection. Please share your work on Observable, or tweet us a link! Visual Index Basic Charts Techniques, Interaction & Animation Maps Statistics Examples Collections The New York Times visualizations Jerome Cukier Jason Davies Jim Vallandingham Institute for Health Metrics and Evaluation Peter Cook Charts and Chart Components Bar Chart Histogram Pareto Chart Line and Area Chart Pie Chart Scatterplot and Bubble chart Parallel Coordinates, Parallel sets and Sankey Sunburst and Partition layout Force Layout Tree Misc Trees and Graphs Chord Layout (Circular Network) Maps Misc Charts Miscellaneous visualizations Charts using the reusable API Useful snippets Tools Interoperability Online Editors Products Store Apps Presentation Next: A Windows 8 HTML5/SVG Presentation Builder Libraries Games Insanity is an D3js based online game developed to train people's reaction time and awareness.
Wish List. Lucidchart. Gliffy. Create A Graph.