

VIS. Visual Investigative Scenarios platform: Pages. 46 Tools To Make Infographics In The Classroom. Infographics are interesting–a mash of (hopefully) easily-consumed visuals (so, symbols, shapes, and images) and added relevant character-based data (so, numbers, words, and brief sentences).
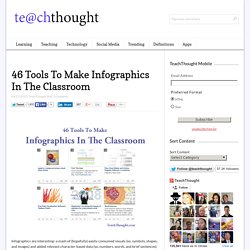
The learning application for them is clear, with many academic standards–including the Common Core standards–requiring teachers to use a variety of media forms, charts, and other data for both information reading as well as general fluency. It’s curious they haven’t really “caught on” in schools considering how well they bridge both the old-form textbook habit of cramming tons of information into a small space, while also neatly overlapping with the dynamic and digital world. A Guide to Infographic Elements. When it comes to visualizing data, it’s important to pick the right graph and the right kind of data range.
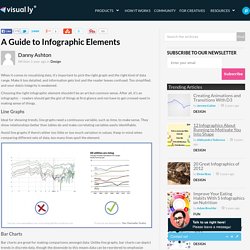
Make it too detailed, and information gets lost and the reader leaves confused. Too simplified, and your data’s integrity is weakened. Choosing the right infographic element shouldn’t be an art but common sense. 9 Powerful Free Infographic Tools To Create Your Own Infographics - DATA VISUALIZATION. 46 Tools To Make Infographics In The Classroom. The Best Animated Infographics and Motion Graphics Examples. How Green Is Your Internet? How Green Is Your Internet? When you use the internet have you thought just how much energy you’re using? This story may give you some […] View the interactive example → Stuxnet: Anatomy of a Computer Virus.
Материалы Вебинара «Создание инфографики» Ways to Teach Using Infographics. However, today I am sharing with you a great video by Kathy Shrock on Infographics as creative assessments.
Here are some of the important ideas included in the video : Infograpics - a short history. 10 Tools for Creating Infographics and Visualizations. The author's posts are entirely his or her own (excluding the unlikely event of hypnosis) and may not always reflect the views of Moz.

Hello there! I'm Miranda Rensch, Product Manager at SEOmoz and lover of visual communication. Communicating visually is one of the most effective ways to explain complex concepts and relationships, and can be a great way to explain your services/products and create valuable site content. Как сделать инфографику в RealtimeBoard. 4 Excellent Infographics on 21st Century Classroom. We keep talking alot about the 21st century teachers and students and the skills they need to have but what about the 21st century classroom ?

Does it resemble the old traditional classroom or is it different ? Well, probably all of you would agree that we are in front of a new type of classroom, one that is hugely impacted and revolutionized by the integration of technology inside its four corners. It has become an open space of collaborative learning where production is valued over retention, and where communication is the backbone of the learning process. 21st century classroom is idiosyncratic in its features. Нэнси Дуарте «Slide:ology» ~ Инфографика в примерах. Основные программы ~ Инфографика в примерах. Очень частый вопрос в чем делается инфографика, какие основные программы используются для создания инфографики.
20 Great Infographics of 2012. 2012 has certainly been an eventful year, with everything from elections, to olympics, to scientific breakthroughs, to major weather events.

To help review some of the things that happened, here are 20 of the best static infographics from the year. 1. There were several space related events this year. NASA’s Curiosity rover landed on mars, and successfully began collecting data. As this graphic by billowyclouds shows, the scariest part was a terrifying 7 minute landing. 60+ Great Educational Infographics for your Clasroom. Infographics are an amazing learning and teaching tools.
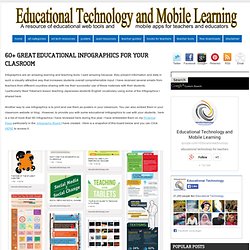
I said amazing because they present information and data in such a visually attractive way that increases students overall comprehensible input. I have received several emails from teachers from different countries sharing with me their successful use of these materials with their students. I particularly liked Yokama's lesson teaching Japaneses students English vocabulary using some of the Infographics I shared here. Another way to use Infographics is to print and use them as posters in your classroom. You can also embed them in your classroom website or blog .
Занимательная инфографика - Инфографика. These are The Hardest Languages to Learn. Below is a great infographic that I want to share with you.
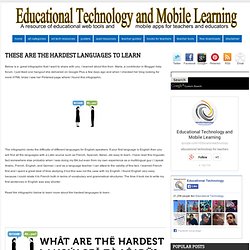
I learned about this from Marie, a contributor in Blogger help forum. I just liked one hangout she delivered on Google Plus a few days ago and when I checked her blog looking for more HTML tricks I saw her Pinterest page where I found this infographic. The infographic ranks the difficulty of different languages for English-speakers. If your first language is English then you will find all the languages with a Latin source such as French, Spanish, Italian..etc easy to learn. I have read this linguistic fact somewhere else probably when I was doing my BA but even from my own experience as a multilingual guy ( I speak Arabic, French, English, and German ) and as a language teacher I can attest to the validity of this fact. Read the infographic below to learn more about the hardest languages to learn. A Week of Data Visualization and Infographic Traffic Tips. Generally I’m not a huge fan of infographics.
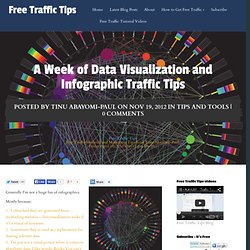
Mostly because: I often find they are generated from misleading statistics – data visualization sucks if it’s a visual of nonsense.Sometimes they’re used as a replacement for sharing relevant dataI’m just not a visual person when it comes to absorbing data. I like words. Books.You can’t skim a video or speed read a graphic. In a recent discovery, however, I’ve learned that shockingly, the world doesn’t resolve around me. Coolcatteacher.visibli.com/share/ctCaQo. The State of Infographics in Education. Infographics In The Classroom. INFOGRAPHICS. The Ultimate Guide To Infographics. What Are Infographics? I found many definitions of what Infographics are as well as explanations of how they are useful in a variety of settings. Here are a couple of the definitions I liked followed by their sources: Information graphics or infographics are graphic visual representations of information, data or knowledge.
These graphics present complex information quickly and clearly, such as in signs, maps, journalism, technical writing, and education. With an information graphic, computer scientists, mathematicians, and statisticians develop and communicate concepts using a single symbol to process information. Infographies. How To Create Outstanding Modern Infographics. In this tutorial you will learn that data doesn't have to be boring, it can be beautiful!

Learn how to use various graph tools, illustration techniques and typography to make an accurate and inspiring infographic in Adobe Illustrator. Start by using the Rectangle Tool (M) to draw a shape. Give it a subtle radial gradient too. The entire design is based on a grid of four columns. To make the columns first select the rectangle and drag a guide onto the centre of the shape. Condense the shape so it fits within the left-most guide and centre guide. Move the shape over to the right and add another guide to the centre here.
Using the Rectangle Tool (M) draw a thin white box on the centre line that will be the width of the gap between the columns. Graphs Infographics. Инфографика. Инфогра́фика (от лат. informatio — осведомление, разъяснение, изложение; и др. A List of Great Educational Infographics. 22inShare I see there is a lot of interaction with the infographics I post here and that proves that you like the visually appealing posts. I do too and I think most of the people like to learn visually. Your students would love to have visual aids integrated into their classroom . About. Инфографика как многофункциональный инструмент в обучении. В рамках конференции Intel «Новая школа: мой маршрут» заканчивает свою работу мастер-класс Натальи Кубрак « Инфографика как результат представления ученического исследования «. В мастер-классе приняли участие более 200 человек.
Перед участниками были поставлены цели: разобраться с понятием инфографика, ознакомиться с новыми сервисами для визуализации информации, создав свою инфографику, продумать возможные способы применения инфографики в образовательной деятельности. «Инфографику за 5 минут» как обещают на некоторых сайтах, рекламирующих разные инструменты ее создания, конечно же, не создашь. И даже в рамках мастер-класса, (особенно если ты впервые сталкиваешься с этими сервисами) осмысленную инфографику создать непросто, это требует времени и на обдумывание и на воплощение идеи. An Interactive Graphic.
Blogger Quick View Twitter Quick View Scoop.It Quick View MentorMob Quick View ThingLink Quick View. Data Visualization Tools. Eight Free tools for Teachers to Make Awesome Infographics. 1- Easel.ly This is a great tool that allows users to create visually rich infographics from pre-designed themes. It is very easy to use and only drag and drop. It actually supports Chrome, Firefox, and Safari. 2- Stat Planet This one here allows users to create amazing visualisations and share them with others.
It can be used either within your browser or download the software for free. 3- Hohli This is an awesome chart maker. 4- Creately This is also a great tool in creating diagrams and flow charts. How To Create An Infographic - With No Discernible Talent Whatsoever. Click to embiggen. Piktochart. Tools And Resources For Creating Infographics. Infographics. Make Your Images Interactive - ThingLink. Creating Infographics with Students Make Your Images Interactive - ThingLink. Infographics & Data Visualizations. PowerPoint: Create an Infographic. By AJ George.
5 Infographic Generator Apps Every Teacher Should Know About. 20 Infographic Sites to Enhance Your Classroom. 20 Infographic Sites to Enhance Your Classroom Posted on Wed, Sep 26, 2012 @ 11:26 AM Thanks to the Internet, anyone with a cell phone can not only find, but disseminate information to anywhere—from anywhere—in the world within seconds. Create Infographics online. 10 Fun Tools To Easily Make Your Own Infographics. Инфографика в примерах. Infographer » Российский сайт Инфографики.
5 советов по созданию осмысленной инфографики ~ Инфографика в примерах. Иногда в этом блоге появляются статьи из других, в том числе и иностранных блогов. Вот одна из них. Если вы читаете эту статью на SocialMediaToday, вы, вероятно, знаете гораздо больше о механике создания инфографики, чем я. Если вы читаете это на моем блоге, возможно нет (а если на – возьмите с полки пирожок! Инфографика и визуализация для образования. Инфографика – где брать, как делать и что она дает? Инфографика и визуализация для образования. 10 Fun Tools To Easily Make Your Own Infographics.