
The Tail End. We made a fancy PDF of this post for printing and offline viewing. Buy it here. In a post last year, we laid out the human lifespan visually. By years: By months: And by weeks: While working on that post, I also made a days chart, but it seemed a bit much, so I left it out. The days chart blows my mind as much as the weeks chart. But since doing the Life in Weeks post, I’ve been thinking about something else. Instead of measuring your life in units of time, you can measure it in activities or events. I’m 34, so let’s be super optimistic and say I’ll be hanging around drawing stick figures till I’m 90. And maybe around 60 Superbowls left: The ocean is freezing and putting my body into it is a bad life experience, so I tend to limit myself to around one ocean swim a year. There have been eight US presidential elections during my lifetime and about 15 to go.
I probably eat pizza about once a month, so I’ve got about 700 more chances to eat pizza. Relationships. 2) Priorities matter. Your Life in Weeks. Note: If you want to print this post or read it offline, the PDF is probably the way to go.
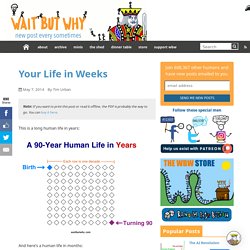
You can buy it here. This is a long human life in years: And here’s a human life in months: But today, we’re going to look at a human life in weeks: Each row of weeks makes up one year. It kind of feels like our lives are made up of a countless number of weeks. Before we discuss things further, let’s look at how a typical American spends their weeks: Sources: [1] There are some other interesting ways to use the weeks chart: But how about your weeks?
Sometimes life seems really short, and other times it seems impossibly long. Given that fact, the only appropriate word to describe your weeks is precious. If you multiply the volume of a .05 carat diamond by the number of weeks in 90 years (4,680), it adds up to just under a tablespoon. Looking at this spoon of diamonds, there’s one very clear question to ask: “Are you making the most of your weeks?” 1) Enjoying the diamond. Life expectancy. A measure of average lifespan in a given population Life expectancy at birth, measured by region, between 1950 and 2050 Life expectancy by world region, from 1770 to 2018 National LEB figures reported by statistical national agencies and international organizations are indeed estimates of period LEB.
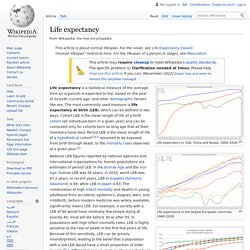
In the Bronze Age and the Iron Age, LEB was 26 years; the 2010 world LEB was 67.2 years. For recent years, LEB in Eswatini (Swaziland) is about 49, while LEB in Japan is about 83. Mathematically, life expectancy is the mean number of years of life remaining at a given age, assuming age-specific mortality rates remain at their most recently measured levels.[3] It is denoted by ,[a] which means the mean number of subsequent years of life for someone now aged , according to a particular mortality experience. Lindy effect. The Lindy effect is a concept that the future life expectancy of some non-perishable things like a technology or an idea is proportional to their current age, so that every additional period of survival implies a longer remaining life expectancy.[1] Where the Lindy effect applies, mortality rate decreases with time.
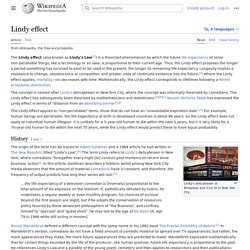
In contrast, living creatures and mechanical things follow a bathtub curve where, after "childhood", the mortality rate increases with time. Because life expectancy is probabilistically derived, a thing may become extinct before its "expected" survival. In other words, one needs to gauge both the age and "health" of the thing to determine continued survival. History[edit] Goldman (1964)[edit] ... the life expectancy of a television comedian is [inversely] proportional to the total amount of his exposure on the medium. Mandelbrot (1982)[edit] Taleb (2007)[edit] With human projects and ventures we have another story. Taleb (2012)[edit] Usage[edit] Pareto distribution[edit] . . Or.