
InMaps - Visualize your LinkedIn network. Free Vector Infographic Kit. This week’s freebie is a huge vector set for creating infographics.
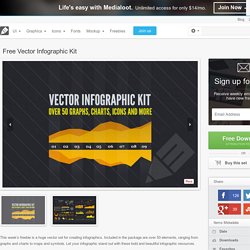
Included in the package are over 50 elements, ranging from graphs and charts to maps and symbols. Let your infographic stand out with these bold and beautiful infographic resources. In the download the filetypes are AI, EPS and SVG so you can use this kit at any scale, easily edit the color scheme, and the data points. Enjoy! Free License Feel free to download and use this item for both personal and commercial projects with attribution back to MediaLoot. Attribution is required for free items. Create A Graph.
Graphic Organizers. Graphe conceptuel. Un article de Wikipédia, l'encyclopédie libre.
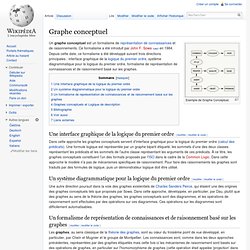
Exemple de Graphe Conceptuel. Un graphe conceptuel est un formalisme de représentation de connaissances et de raisonnements. Ce formalisme a été introduit par John F. Sowa (en) en 1984. Depuis cette date, ce formalisme a été développé suivant trois directions principales : interface graphique de la logique du premier ordre, système diagrammatique pour la logique du premier ordre, formalisme de représentation de connaissances et de raisonnement basé sur les graphes. Une interface graphique de la logique du premier ordre[modifier | modifier le code] Dans cette approche les graphes conceptuels servent d'interface graphique pour la logique du premier ordre (calcul des prédicats). Un système diagrammatique pour la logique du premier ordre[modifier | modifier le code] Une autre direction poursuit dans la voie des graphes existentiels de Charles Sanders Peirce, qui étaient une des origines des graphes conceptuels tels que proposés par Sowa.
Diagrammr. How Video Games Are Changing Education. 7 Tools for Creating Flowcharts, Mind Maps, and Diagrams. ChartGo - Graph and Charts Fast, Easy and Free. Raw. Graphic Organizer Worksheets. Advertisement.
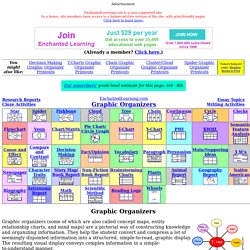
EnchantedLearning.com is a user-supported site. As a bonus, site members have access to a banner-ad-free version of the site, with print-friendly pages.Click here to learn more. (Already a member? Click here.) Graphic Organizers Graphic organizers (some of which are also called concept maps, entity relationship charts, and mind maps) are a pictorial way of constructing knowledge and organizing information. Increasing Understanding by Creating Graphic Organizers: The process of converting a mass of data/information/ideas into a graphic map gives the student an increased understanding and insight into the topic at hand. The creation of graphic organizers also helps the student generate ideas as they develop and note their thoughts visually.
Create and share visual ideas online. The Best Flowchart Software of 2016. Programmi per organigrammi gratis. I migliori programmi per disegnare organigrammi gratis.
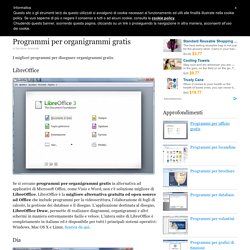
LibreOffice Se si cercano programmi per organigrammi gratis in alternativa ad applicativi di Microsoft Office, come Visio e Word, non c’è soluzione migliore di LibreOffice. LibreOffice è la migliore alternativa gratuita ed open source ad Office che include programmi per la videoscrittura, l’elaborazione di fogli di calcolo, la gestione dei database e il disegno. L’applicazione destinata al disegno, LibreOffice Draw, permette di realizzare diagrammi, organigrammi e altri schermi in maniera estremamente facile e veloce. Premium Content Creation for Better Marketing. Five Free Infographic Templates. Infographics are a powerful tool for capturing the attention of your target audiences.
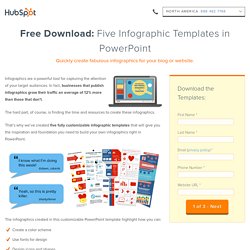
In fact, businesses that publish infographics grow their traffic an average of 12% more than those that don’t. The hard part, of course, is finding the time and resources to create these infographics. That’s why we’ve created five fully customizable infographic templates that will give you the inspiration and foundation you need to build your own infographics right in PowerPoint. The infographics created in this customizable PowerPoint template highlight how you can: Create a color schemeUse fonts for designDesign icons and shapesWork with a theme. Sparklines for Excel®: Treemap. How does it work ? Inspiration I did some research on the net and mainly used Jonathan Hodgson's post on codeproject.com, dating from june 2004, that describes the Squarified treemap technique.
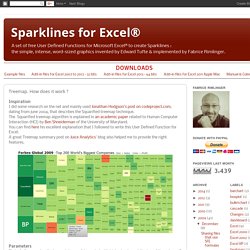
The Squarified treemap algorithm is explained in an academic paper related to Human Computer Interaction (HCI) by Ben Shneiderman of the University of Maryland. You can find here his excellent explanation that I followed to write this User Defined Function for Excel. A great Treemap summary post on Juice Analytics' blog also helped me to provide the right features. Parameters First of all, remember that your data must be sorted with highest values at the top of the column (I know, this could easily be integrated in the UDF... sometime maybe). The syntax of the UDF is :TREEMAP(DataRange, DestinationRange, HeightPixel, WidthPixel, ColorRange, ColorScale, LabelRange, TooltipRange, HighlightPosition).
Only DataRange and DestinationRange are compulsory parameters. . - ColorRange : contains the data (number or text !) Online Diagram Software and Flowchart Software. Which Shakespeare Play Should I See? An Illustrated Flowchart. In just 10 DAYS I will be speaking at the Folger Shakespeare Library!
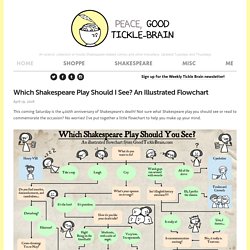
In case you've missed my previous annoucements on this, here are the basic facts: WHO: Me! WHAT: Talking about my comic and live-drawing on stageWHERE: The Folger Theater, Washington D.C.WHEN: Friday, April 29, at 6:00pmWHY: Because it's going to be REALLY SUPER FUNHOW MUCH: Nothing! It's absolutely FREE! You can reserve a FREE ticket at the Folger website.