
Hadley (Hadley Wickham) Tutorials Tagged with R (#rstats) – NEON Work With Data. Courses/R Stuff. Courses > R Stuff More R… useful material compiled by the community Guides & reference cards websites.
R useful functions. Just a (very incomplete) list of R functions. builtins() # List all built-in functions options() # Set options to control how R computes & displays results ?
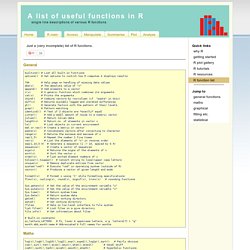
NA # Help page on handling of missing data values abs(x) # The absolute value of "x" append() # Add elements to a vector c(x) # A generic function which combines its arguments cat(x) # Prints the arguments cbind() # Combine vectors by row/column (cf. Log(x),logb(),log10(),log2(),exp(),expm1(),log1p(),sqrt() # Fairly obvious cos(),sin(),tan(),acos(),asin(),atan(),atan2() # Usual stuff cosh(),sinh(),tanh(),acosh(),asinh(),atanh() # Hyperbolic functions union(),intersect(),setdiff(),setequal() # Set operations +,-,*,/,^,%%,%/% # Arithmetic operators <,>,<=,>=,==,! UsingR. Data-wrangling-cheatsheet.
R and Matlab programming. Forecasting: principles and practice. Welcome to our online textbook on forecasting.
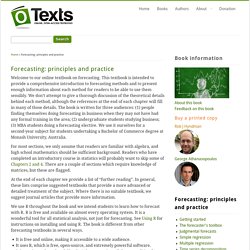
This textbook is intended to provide a comprehensive introduction to forecasting methods and to present enough information about each method for readers to be able to use them sensibly. We don’t attempt to give a thorough discussion of the theoretical details behind each method, although the references at the end of each chapter will fill in many of those details. The book is written for three audiences: (1) people finding themselves doing forecasting in business when they may not have had any formal training in the area; (2) undergraduate students studying business; (3) MBA students doing a forecasting elective. We use it ourselves for a second-year subject for students undertaking a Bachelor of Commerce degree at Monash University, Australia. For most sections, we only assume that readers are familiar with algebra, and high school mathematics should be sufficient background. Use the table of contents on the right to browse the book. rCharts.
Using R for Time Series Analysis — Time Series 0.2 documentation. Reading Time Series Data The first thing that you will want to do to analyse your time series data will be to read it into R, and to plot the time series.
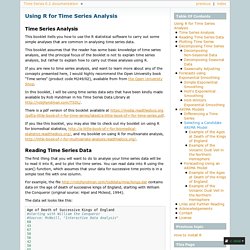
You can read data into R using the scan() function, which assumes that your data for successive time points is in a simple text file with one column. For example, the file contains data on the age of death of successive kings of England, starting with William the Conqueror (original source: Hipel and Mcleod, 1994). The data set looks like this: Age of Death of Successive Kings of England #starting with William the Conqueror#Source: McNeill, "Interactive Data Analysis"604367505642506568436534... Only the first few lines of the file have been shown. > kings <- scan(" Read 42 items > kings [1] 60 43 67 50 56 42 50 65 68 43 65 34 47 34 49 41 13 35 53 56 16 43 69 59 48 [26] 59 86 55 68 51 33 49 67 77 81 67 71 81 68 70 77 56 In this case the age of death of 42 successive kings of England has been read into the variable ‘kings’.
Home Page. AboutHydrology: R resources for Hydrologists. R is my statistical software of election.
I had hard time to convince my Ph.D. students to adopt it, but finally they did, and, as usually happens, many of them became more proficient than me in the field. Now it seems natural to use it for everything, but this was not always the case. A list of introductory material is here. A nice series of video tutorial on R was just posted by the Google Developers Group, on youTube, here. Recently many resources were added for hydrologists, which I list below with a little comment.RWater: A Cyber-enabled Data-driven Tool for Enhancing Hydrology EducationHydroGOF and HydroTSM by Mauricio Zambrano-Bigiarini. In R there are also many toolkit for the analysis of extreme events. Packages we like - The HydroFilesThe HydroFiles. MATLAB scripts and programs. USGS Online Publications Directory. R Books. Hydraulic and Environmental Engineering. DHI released the new MATLAB DFS interface library.

This is a major extension compared to the previous version (2004). The new version supports e.g. read and write of flexible mesh data (dfsu 2D and 3D). MATLAB® Recipes for Earth Sciences - Martin Trauth. Using_ml. MIT 18.S997 Introduction to MATLAB Programming Fall 2011. The Command Line Crash Course Controlling Your Computer From The Terminal. Learn Python The Hard Way. This exercise has no code.
It is simply the exercise you complete to get your computer to run Python. You should follow these instructions as exactly as possible. AOS 575: Climatological Analysis. Sample code for setting up a map axis to plot a polar-stereographic plot: plot_polar_stereo.m EOF Analysis eof_routine.m cosweight.m Suppose you want to perform EOF analysis on tropical Pacific SST from the NCEP reanalysis.
Here's a quick way to do that, assuming you've downloaded my matlab libraries, above: lims = [120 285 -30 30]; tim = get_time(1948,2002,1948); [sst, lat, lon] = getnc2('skt.mon.mean.nc', 'skt', lims, 1, tim); land = getnc2('land.sfc.gauss.nc', 'land', lims, 1, 1); sst = remove_anncyc(sst); sst = cosweight(sst, lat); [lam, lds, pcs, per] = eof_routine(sst(:,land==0)); % Get a scaled map of the leading EOF eof1 = repmat(NaN, [length(lat) length(lon)]); eof1(land == 0) = lds(:,1)*sqrt(lam(1)); eof1 = uncosweight(eof1, lat); chi2example.m: 1.
A demo for using the Chi2 distribution to determine confidence limits on variance 2. Example2_16_Feb.m: This example demonstrates how to generate regression maps of SST or 500mb height onto the CTI. Water Programming: A Collaborative Research Blog. Have you done Part 1a yet?
How about Part 1b? Go do those first, and come back with metrics.txt, which has all of the data in a single file. Afterwards, please check out Part 2. We’re interested in Borg’s runtime metrics because they tell us interesting things about the problem we’re optimizing. See the Borg paper for more details. Please consider this one released under the MIT license. Water Programming: A Collaborative Research Blog. This post was updated on August 11, 2014 to update the SALib module structure.
The Sensitivity Analysis Library (SALib) is an open-source Python library for common sensitivity analysis routines, including the Sobol, Morris, and FAST methods. Step 0: Get the library The easiest way to install is pip install SALib, which will pull the latest version from the Python package index. Or, you can download at the above link and run python setup.py install. How to add RMSE, slope, intercept, r^2 to R plot? R: Root Mean Square Error. Description Root Mean Square Error (RMSE) between sim and obs, in the same units of sim and obs, with treatment of missing values. RMSE gives the standard deviation of the model prediction error. A smaller value indicates better model performance. R: Nash-Sutcliffe Efficiency. Description Nash-Sutcliffe efficiency between sim and obs, with treatment of missing values. Usage NSE(sim, obs, ...) ## Default S3 method: NSE(sim, obs, na.rm=TRUE, ...) ## S3 method for class 'data.frame' NSE(sim, obs, na.rm=TRUE, ...) ## S3 method for class 'matrix' NSE(sim, obs, na.rm=TRUE, ...) ## S3 method for class 'zoo' NSE(sim, obs, na.rm=TRUE, ...)
Arguments. R4Hydrology – Communauté – Google+ MATLAB Source Codes. Analemma, a program which evaluates the equation of time, a formula for the difference between the uniform 24 hour day and the actual position of the sun, based on a C program by Brian Tung. MATLAB Central - HBV Hydrologic Model - Education Version (MATLAB Code) - What are tags? A tag is like a keyword or category label attached to an entry in the Link Exchange.
Tags make it easier to find or recall particular links of interest. They're also a good way to categorize your bookmarked items, so you can browse your bookmarks by subject. Tags benefit the community, too. Anyone who is logged in can tag a Link Exchange item. What makes a good tag? A good tag helps people find the entry. How to Tag Tag your new submission Start typing in the Tag box, or click on a tag from the list that displays near the box.