
How to use Amazon Mechanical Turk to perform tasks too complex to compute. Computing has come a long way in the last decade—optical character recognition (OCR) software is adept at reading printed text and voice recognition software can understand normal speech.
But, there are still many tasks for which it is impractical to use computers, such as labeling objects in an image, separating safe for work images from indecent ones, or ensuring product catalogs do not contain duplicate entries. Microwork platforms like Amazon Mechanical Turk connect requesters with tasks that are easy for humans to do to workers who can perform them. What you can do with Mechanical Turk With Mechanical Turk, requesters can create Human Intelligence Tasks (HITs) for providers—that is, the people working to respond to your requests—to perform. These tasks can be practically anything that can be performed while using a computer. There are specific circumstances for which you can categorize your HITs.
What to know when making your first HIT What's your view? Also see. DSC Data Science Search Engine. Monitor360 - Narrative Analytics, Consulting firms, Global Strategy.
Sensing. Artificial Intelligence. Social Network Analysis for beginners. In the last few decades, Social Network Analysis (SNA) has established itself as one of the essential tools for sociology.

And computer science. 50+ Data Science and Machine Learning Cheat Sheets. Gear up to speed and have Data Science & Data Mining concepts and commands handy with these cheatsheets covering R, Python, Django, MySQL, SQL, Hadoop, Apache Spark and Machine learning algorithms.
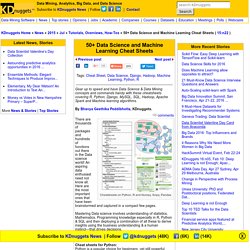
Cheatsheets on Python, R and Numpy, Scipy, Pandas There are thousands of packages and hundreds of functions out there in the Data science world! Untitled. Statistical Modeling, Causal Inference, and Social Science - Statistical Modeling, Causal Inference, and Social Science. Predictive Analytics, Data Mining, Self-service, Open source - RapidMiner. The data science ecosystem. Data science isn't new, but the demand for quality data has exploded recently.
This isn't a fad or a rebranding, it's an evolution. Decisions that govern everything from successful presidential campaigns to a one-man startup headquartered at a kitchen table are now based on real, actionable data, not hunches and guesswork. Because data science is growing so rapidly, we now have a massive ecosystem of useful tools. I've spent the past month or so trying to organize this ecosystem into a coherent portrait and, over the next few days, I'm going to roll it out and explain what I think it all means. Since data science is so inherently cross-functional, many of these companies and tools are hard to categorize. CrowdFlower What's the point of doing this?
The Data Engineering Ecosystem: An Interactive Map. David Drummond and John Joo March 6, 2015 David Drummond Insight Data Engineering Program Director John Joo Insight Data Engineering and Data Science Program Director Companies, non-profit organizations, and governments are all starting to realize the huge value that data can provide to customers, decision makers, and concerned citizens.
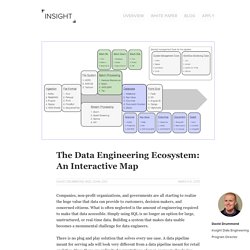
What is often neglected is the amount of engineering required to make that data accessible. Simply using SQL is no longer an option for large, unstructured, or real-time data. Building a system that makes data usable becomes a monumental challenge for data engineers. There is no plug and play solution that solves every use case.
Which Programming Language Should I Learn First? Big Data Analytics 2014. Atul Kr. Jha on Twitter: "Data Scientist skillset, do you agree? #DataScience #BIGDATA #DataAnalytics #Analytics... Frequently updated Machine Learning blogs. The Top 100 Big Data Influencers. Yesterday, Onalytica released their report, announcing the top 100 big data influencers, and top 100 influencing brands, based on analysis of the #BigData hashtag on Twitter.
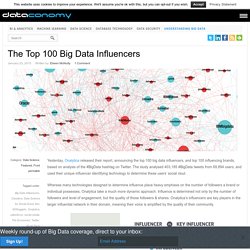
The study analysed 403,185 #BigData tweets from 69,894 users, and used their unique influencer identifying technology to determine these users’ social clout. Whereas many technologies designed to determine influence place heavy emphasis on the number of followers a brand or individual possesses, Onalytica take a much more dynamic approach. Influence is determined not only by the number of followers and level of engagement, but the quality of those followers & shares.
Onalytica’s influencers are key players in the larger influential network in their domain, meaning their voice is amplified by the quality of their community. Onalytica’s “Key Influencer” definition- source. Top KDnuggets tweets, Jan 5-6: Great post: Deep Learning in a Nutshell; Big Data visualized in so many ways. Great post: #DeepLearning in a Nutshell: what it is, how does it work, and why care; #BigData is visualized in so many ways...; Review of @deanabb book "Applied Predictive Analytics" ; Free Predictive Modeling Education Videos - Learn #DataScience at your own pace.
Most popular @KDnuggets tweets for Jan 05-06 were Most Retweeted: Great post: #DeepLearning in a Nutshell: what it is, how does it work, and why you should care t.co/srD7ccK5xq t.co/nVbAz061WQ Most Favorited: Great post: #DeepLearning in a Nutshell: what it is, how does it work, and why you should care t.co/srD7ccK5xq t.co/nVbAz061WQ Most Viewed: #BigData is visualized in so many ways..all of them blue & with numbers & lens flare. t.co/Kg9FGeln2q #Tumblr t.co/jQodcAjXwe.
Hadoop successor sparks a data analysis evolution. If 2014 was the year that Apache Hadoop sparked the big data revolution, 2015 may be the year that Apache Spark supplants Hadoop with its superior capabilities for richer and more timely analysis.
“There is a strong industry consensus that Spark is the way to go,” said Curt Monash, head of the IT analyst firm Monash Research. “Next year, you will see a lot of [Hadoop] use cases that transcend Hadoop,” said Ali Ghodsi, CEO and co-founder of Databricks, a company formed by a number of the creators of Spark that offers a hosted Spark service, as well as technical support for software distributors selling Spark packages. Spark is an engine for analyzing data stored across a cluster of computers. Specialization. Data Science Central. Web Data Platform & Free Web Scraping Tool.
Modeling & simulation. Maps. Modeling and Simulation Resources. The enormous potential of digital computation to manage new complex systems is impeded by exponential increases in complexity.
The model's dimensionality increases from hundreds to thousands of variables, therefore, it is necessary have sub-models constructed by diverse technical teams to be integrated into the total computer simulation model. This site presents access to the recent advances in computer simulation for decision making that is of interest to researchers and graduate students across a number of academic domains. I always welcome information regarding any further references for inclusion. You may like to contact me by sending me an email your comments/suggestions or corrections for improvement.
Thank you. To search the site, try Edit | Find in page [Ctrl + f]. Companion Sites: Archival Journal Articles: Authors' Index Abstract of the papers may be found at: MATH General Resources Interesting and Useful Sites (topical category) General Resources Monte Carlo in Action. Systems Simulation. Problem Formulation: Identify controllable and uncontrollable inputs.
Identify constraints on the decision variables. Define measure of system performance and an objective function. Develop a preliminary model structure to interrelate the inputs and the measure of performance. Data Collection and Analysis: Regardless of the method used to collect the data, the decision of how much to collect is a trade-off between cost and accuracy. Simulation Model Development: Acquiring sufficient understanding of the system to develop an appropriate conceptual, logical and then simulation model is one of the most difficult tasks in simulation analysis.
Modeling sim overview. Modeling, Simulation, Wargaming & Analysis. Congressional Modeling and Simulation Caucus - Congressman J ... Law modeling simulation. Issues in visualization of risk and vulnerability. Risk analysis tends to be a highly mathematically, statistically, and let alone probabilistically oriented science. Risk maps derived from risk analysis often portray only one possible scenario and do not leave much room for personal interpretation.
Data on risks and hazards often tend to be heterogeneous, complex, inter-dependent, not directly comparable, and correlated in ways that are not immediately apparent. Visualization technology has emerged as a form of exploratory cartography, which can help explain, analyze and communicate risk. Because the risk analyst and the public in general may differ on what constitutes a risk or what not, visualization techniques can help the risk assessor better understand underlying factors and generate better risk maps, thus communicating a clearer message to the public. Examples of how risk should be communicated are presented and discussed along with current visualizations. Introduction We live in an advanced and seemingly peaceful society. Drought. WSC Archive. Spatial.ly. Big Data Is Nothing If Not Visual. "The Visual Organization" author Phil Simon discusses data visualization tools and their power to change business conversations.
Big data can be big chaos. But finding clarity -- and business opportunities -- in that chaos has never been more important. Presenting data clearly and visually is now as important as finding it. Enter data visualization tools that create heat maps, data relationship trees, and geospatial overlays. They provide visual ways to explain a sales trend to the CEO in a few minutes. The Weekend Interview: Leapfrogging the Democrats' Tech Advantage - WSJ. Big Data explained in this infographic from Kapow Software. 'Big data' collection from Google can be misleading: Study. Tuesday, 18 March 2014 11:46 Posted by Parvez Jabri ISLAMABAD: A significant research has put 'big data' collections from platforms such as Google, Twitter and Facebook in the dock, stating that campaigns and companies can manipulate these platforms to ensure their products or issues are trending.
To cement their view, authors examined Google's data-aggregating tool Google Flu Trend (GFT) which was designed to provide real-time monitoring of flu cases around the world based on Google searches that matched terms for flu-related activity, CBC news reported. "Google Flu Trend is an amazing piece of engineering and a very useful tool but it also illustrates where big data analysis can go wrong," said Ryan Kennedy, a political science professor at University of Houston. He and co-researchers detailed new research about the problematic use of big data from aggregators such as Google. Additionally, from August 2011 to September 2013, GFT over-predicted the prevalence of flu in 100 out of 108 weeks.
Wolfram Language Demo. Tracking the march of the robot economy. Big Data and Business Decision Making. Back in 1956, an engineer and a mathematician, William Fair and Earl Isaac, pooled $800 to start a company. Their idea: a score to handicap whether a borrower would repay a loan. It was all done with pen and paper. Income, gender, and occupation produced numbers that amounted to a prediction about a person’s behavior. By the 1980s the three-digit scores were calculated on computers and instead took account of a person’s actual credit history. Today, Fair Isaac Corp., or FICO, generates about 10 billion credit scores annually, calculating 50 times a year for many Americans. This machinery hums in the background of our financial lives, so it’s easy to forget that the choice of whether to lend used to be made by a bank manager who knew a man by his handshake. Huberty_etla_big_data.
How Big Data profits from your personal information. But if you can’t beat them, how about joining them? Nearly half of Canadians — 45 per cent — said they’re interested in selling their data for rewards, according to a survey by Microsoft. Now some websites are popping up to give you the tools. Datacoup is a New York startup that pays to access your data, including your social networks and credit card statements. Currently in beta testing, the company will eventually sell intel on its users to marketing companies (after removing any personally identifying information). 74,476 Reasons You Should Always Get The Bigger Pizza : Planet Money. One day last year, an engineer and I went to a pizza place for lunch. The engineer told me he wasn't very hungry, but he said he was going to get the 12-inch medium instead of the 8-inch small — because the medium was more than twice as big as the small, and it cost only a little bit more.
This sort of blew my mind. So I went big on the pizza-value question. The graph below is based on 74,476 prices from 3,678 pizza places around the country. To see how the price of pizzas changes with size — and how much more pizza you get when you get a large — drag the slider at the bottom the graph. The math of why bigger pizzas are such a good deal is simple: A pizza is a circle, and the area of a circle increases with the square of the radius. Ionic Seed App. Data Visualization. Global Leader in Data Warehousing, Big Data Analytic Technologies & Data Driven Marketing - Teradata.
The real promise of big data: It's changing the whole way humans will solve problems. Little Data Makes Big Data More Powerful - Mark Bonchek. Big data: What’s your plan?