
Introducing 3D Tiles. Demo Showcase. Integrating Cesium with Three.js. This is a guest post by Wilson Muktar about integrating Three.js with Cesium.
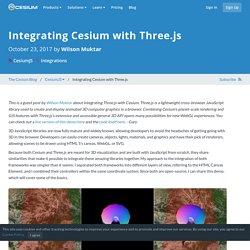
Three.js is a lightweight cross-browser JavaScript library used to create and display animated 3D computer graphics in a browser. Combining Cesium’s planet-scale rendering and GIS features with Three.js’s extensive and accessible general 3D API opens many possibilities for new WebGL experiences. You can check out a live version of this demo here and the code itself here. - Gary 3D JavaScript libraries are now fully mature and widely known, allowing developers to avoid the headaches of getting going with 3D in the browser. Developers can easily create cameras, objects, lights, materials, and graphics and have their pick of renderers, allowing scenes to be drawn using HTML 5’s canvas, WebGL, or SVG.
3D Tiles Photogrammetry Classification - Cesium Sandcastle. Historic Pharsalia Cabin Point Cloud Using Cesium & 3D Tiles. Our friends at Trimble created an amazing 6.4 billion point model of the historic Pharsalia cabins in Virginia.
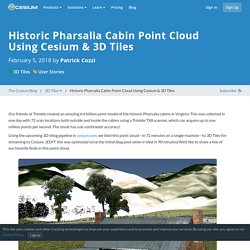
This was collected in one day with 72 scan locations both outside and inside the cabins using a Trimble TX8 scanner, which can acquire up to one million points per second. The result has sub-centimeter accuracy! Using the upcoming 3D tiling pipeline in cesium.com, we tiled this point cloud—in 72 minutes on a single machine—to 3D Tiles for streaming to Cesium. (EDIT: this was optimized since the initial blog post when it tiled in 90 minutes) We’d like to share a few of our favorite finds in this point cloud. LiDAR profile of the Pharsalia site in Virginia. Above, the main cabin is shown with point size attenuation and eye-dome lighting to help highlight the surfaces. Below, we zoomed into the attic of one of the cabins.
Here’s a locked height and angle measurement showing the chimney-to-chimney distance. The point cloud was classified with Trimble’s software. Introducing 3D Tiles. Cesium is the 3D platform for visualizing globes, from every satellite in space to every building in Manhattan to every crater on Mars.
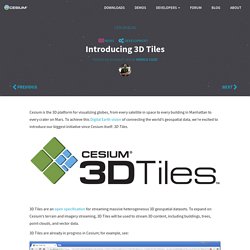
To achieve this Digital Earth vision of connecting the world’s geospatial data, we’re excited to introduce our biggest initiative since Cesium itself: 3D Tiles. 3D Tiles are an open specification for streaming massive heterogeneous 3D geospatial datasets. To expand on Cesium’s terrain and imagery streaming, 3D Tiles will be used to stream 3D content, including buildings, trees, point clouds, and vector data. 3D Tiles are already in progress in Cesium; for example, see: Over 1.1 million OpenStreetMap buildings in New York City.
Point cloud of the Church of St Marie at Chappes, France. Bringing techniques from graphics research, the movie industry, and the game industry to 3D geospatial, 3D Tiles define a spatial data structure and a set of tile formats designed for 3D and optimized for streaming and rendering. Robust Polyline Rendering with WebGL. Rendering with Line Primitives We ran into a few problems when using line primitives (LINES, LINE_STRIP, or LINE_LOOP) to render lines.
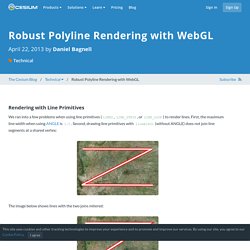
First, the maximum line width when using ANGLE is 1.0. Second, drawing line primitives with lineWidth (without ANGLE) does not join line segments at a shared vertex: The image below shows lines with the two joins mitered: Finally, our method to draw outlined lines without z-fighting was to use three passes with the stencil buffer. Our Method. Polylines on Terrain. Cesium 1.47 added support for polylines on terrain.
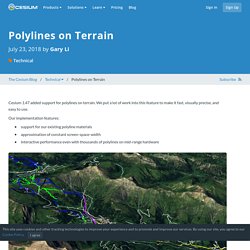
We put a lot of work into this feature to make it fast, visually precise, and easy to use. Our implementation features: support for our existing polyline materials approximation of constant screen-space-width interactive performance even with thousands of polylines on mid-range hardware Ski trails on terrain around Adelboden, Switzerland. Adapted from OpenLayers KML sample data, Copyright (c) OpenStreetMap Contributors under CC-BY-SA 2.0 License Polylines on terrain are available via the Entity API using the clampToGround option: Polylines on terrain via the Primitive API are a new geometry and a new primitive type: Polylines on terrain can also be used via CZML, GeoJSON, and KML (using the tessellate tag), replacing the previous corridor-based substitution in KML and GeoJSON when available. Integrating Cesium with Three.js. Compressing Massive Point Clouds with 3D Tiles and Draco.
Point clouds now load faster than ever in Cesium thanks to Google Draco compression, which we’ve added to the Cesium ion 3D tiling pipeline.
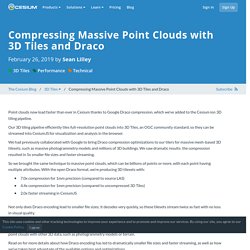
Our 3D tiling pipeline efficiently tiles full-resolution point clouds into 3D Tiles, an OGC community standard, so they can be streamed into CesiumJS for visualization and analysis in the browser. We had previously collaborated with Google to bring Draco compression optimizations to our tilers for massive mesh-based 3D tilesets, such as massive photogrammetry models and millions of 3D buildings. We saw dramatic results: the compression resulted in 5x smaller file sizes and faster streaming. So we brought the same technique to massive point clouds, which can be billions of points or more, with each point having multiple attributes. With the open Draco format, we’re producing 3D tilesets with: Not only does Draco encoding lead to smaller file sizes; it decodes very quickly, so these tilesets stream twice as fast with no loss in visual quality.
Dynamically Annotating 3D Tiles in CesiumJS. Visualizing and understanding massive 3D data often involves combining different formats into the same scene. 3D Tiles already enables this kind of data fusion.
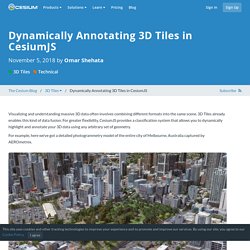
For greater flexibility, CesiumJS provides a classification system that allows you to dynamically highlight and annotate your 3D data using any arbitrary set of geometry. For example, here we’ve got a detailed photogrammetry model of the entire city of Melbourne, Australia captured by AEROmetrex. Photogrammetry model of the city of Melbourne, Australia, captured by AEROmetrex. Perhaps you’re working on a proposal to improve road safety and you want to be able to see the different kinds of roads in the city. You can take this publicly available road dataset from the Australian government and add it to CesiumJS as a GeoJSON. Photogrammetry model of Melbourne fused with a publicly available GeoJSON road dataset. You can immediately see all public roads (orange), tram networks (green), and main arterial roads (red). CesiumJS - Geospatial 3D Mapping and Virtual Globe Platform.