
The Global Surge in Energy Innovation. 1.
Introduction The global energy system provides, through a complex web of processes and interactions, the foundation for almost all modern human activities. Transportation, heating, light and the electronic systems which drive modern economies all depend on global energy supplies. These supplies are largely fossil-fuel based, with natural gas, liquid fuels and coal providing the input fuels for the vast majority of the world’s energy demands.
The energy sector is substantial, having made up almost 4% of total economic activity for reporting OECD (Organisation for Economic Co-operation and Development) countries in 2009 [1]. Over the past decade, the situation has been changing. This paper examines the major factors associated with the revitalization of energy innovation, the changing distribution of energy R&D resources and the underlying scientific developments which are providing transformative energy opportunities. Innovation systems theory provides the framework for the paper. The Global Surge in Energy Innovation. 5.1.
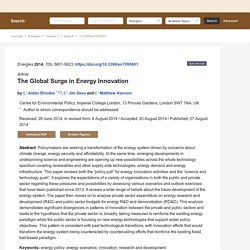
Public R&D Trends As discussed above, policymakers’ interest in energy innovation has sharply increased over the last decade, following a twenty-year slump after the end of the 1970s energy crises. The IEA collects annual data on public sector energy innovation budgets from its member countries. Data is collected using a questionnaire sent by the IEA to relevant government departments, allowing trends in historical data to be compiled. Due to potential differences in the scope and categorisation of data, cross-country comparisons in the level of spend should be taken as indicative. Figure 6 shows the total investment in RD&D in 2012 USD adjusted for purchasing power parity (PPP) across IEA countries 1974–2011 [3], with the average annual price of oil superimposed on the graph [14]. Figure 6. Table 2. The figures for energy public RD&D in IEA member states are dominated by three regions: the US, Europe and Japan. Figure 7. Figure 8. Figure 9. Figure 10. Table 3. Figure 10. Historic Public Energy Spend by Sector for the major European economies 1974–2011.
Depuis 40 ans, les subventions au nucléaire écrasent tout ! - TRANSITION ÉNERGÉTIQUE. Alors que le fonctionnement des marchés de l'énergie ainsi que l'ampleur et l'impact des interventions publiques font débat depuis des années, la Commission européenne a commandé une étude visant à quantifier l'ampleur de ces interventions dans l'ensemble des 28 États membres.
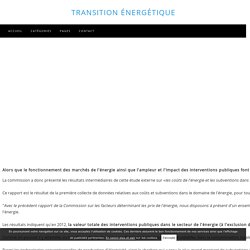
La commission a donc présenté les résultats intermédiaires de cette étude externe sur «les coûts de l'énergie et les subventions dans le secteur de l'énergie dans l'Union européenne». Ce rapport est le résultat de la première collecte de données relatives aux coûts et subventions dans le domaine de l'énergie, pour toutes les technologies de production d'électricité dans tous les États membres de l'Union européenne. Infographics. Feel free to download and reuse our graphics according to their CC BY SA license.
You can individually download each infographic below. Alternatively, you can collectively download an archive containing all our infographics as pdf, png or jpg. Germany continues to produce more GDP with less energy (Read more at 2.A – Efficiency) Germany’s plan: ramp up renewables, drive down energy consumption (Read more at 2.A – Efficiency) Wind turbines 40 times more powerful today than 20 years ago (Read more at 2.C – Wind power) Germany’s installed solar PV capacity is already half of power demand (Read more at 2.E – Photovoltaics)
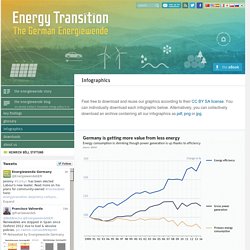
B – Less electricity from coal. To meet the climate targets, Germany must reduce electricity from coal.
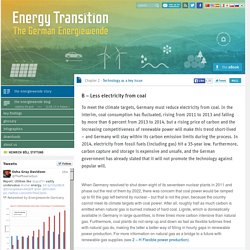
In the interim, coal consumption has fluctuated, rising from 2011 to 2013 and falling by more than 6 percent from 2013 to 2014, but a rising price of carbon and the increasing competitiveness of renewable power will make this trend short-lived – and Germany will stay within its carbon emission limits during the process. In 2014, electricity from fossil fuels (including gas) hit a 35-year low.
Furthermore, carbon capture and storage is expensive and unsafe, and the German government has already stated that it will not promote the technology against popular will. When Germany resolved to shut down eight of its seventeen nuclear plants in 2011 and phase out the rest of them by 2022, there was concern that coal power would be ramped up to fill the gap left behind by nuclear – but that is not the plan, because the country cannot meet its climate targets with coal power.
Plans for new coal plants. Figure 13.1 - AR4 WGIII Chapter 13: Policies, instruments, and co-operative arrangements.