
Browser Automation, Data Extraction and Web Testing. Data Visualization with D3.js. Quartz/Chartbuilder. The Miso Project. Data Wrangler. UPDATE: The Stanford/Berkeley Wrangler research project is complete, and the software is no longer actively supported.
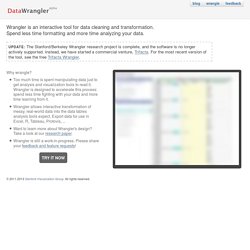
Instead, we have started a commercial venture, Trifacta. For the most recent version of the tool, see the free Trifacta Wrangler. Why wrangle? Geocoding Web Service - MapQuest Platform. The geocoding service enables you to take an address and get the associated latitude and longitude.
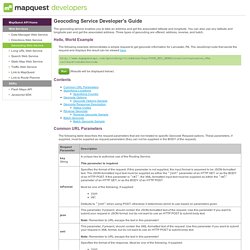
You can also use any latitude and longitude pair and get the associated address. Three types of geocoding are offered: address, reverse, and batch. The following example demonstrates a simple request to get geocode information for Lancaster, PA. The JavaScript code that sends the request and displays the result can be viewed here. Weave (Web-based Analysis and Visualization Environment)
PANDA: A Newsroom Data Appliance 1.1.2 — panda 1.1.2 documentation. About¶ PANDA is your newsroom data appliance.
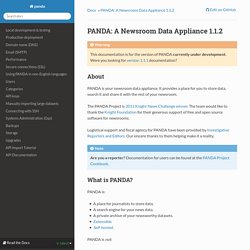
It provides a place for you to store data, search it and share it with the rest of your newsroom. The PANDA Project is 2011 Knight News Challenge winner. The team would like to thank the Knight Foundation for their generous support of free and open source software for newsrooms. Logistical support and fiscal agency for PANDA have been provided by Investigative Reporters and Editors. License¶ The MIT License Copyright (c) 2012 The PANDA Project and contributors Permission is hereby granted, free of charge, to any person obtaining a copy of this software and associated documentation files (the “Software”), to deal in the Software without restriction, including without limitation the rights to use, copy, modify, merge, publish, distribute, sublicense, and/or sell copies of the Software, and to permit persons to whom the Software is furnished to do so, subject to the following conditions:
Onyxfish/csvkit. Built By Balance. Tabletop takes a Google Spreadsheet and makes it easily accessible through JavaScript.
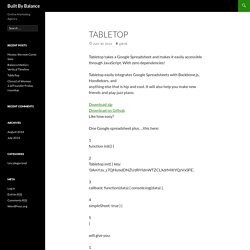
With zero dependencies! Tabletop easily integrates Google Spreadsheets with Backbone.js, Handlebars, and anything else that is hip and cool. It will also help you make new friends and play jazz piano. Download zipDownload on Github Like how easy? One Google spreadsheet plus…this here: 1 function init() { 2 Tabletop.init( { key: ‘0AmYzu_s7QHsmdDNZUzRlYldnWTZCLXdrMXlYQzVxSFE’, 3 callback: function(data) { console.log(data) }, 4 simpleSheet: true } ) will give you: Yep, that’s easy. Getting started 1 Getting your data ready for Tabletop Create a Google Spreadsheet and give it some column headers, and then some content. Google Spreadsheet showing some sample data In Google Docs, go up to the ‘File’ menu and pick ‘Publish to the web.’ Fiddle with whatever you want, then click ‘Start publishing.’ A URL will appear, something like this: Copy the URL! 2 Setting up Tabletop See the ‘postProcess’ call?
Mr. Data Converter. Welcome to freeDive: Data sharing for everyone. Table plug-in for jQuery. Vega: A Visualization Grammar. Highcharts - Interactive JavaScript charts for your webpage.
Interactive GWT and Javascript / HTML5 charts without any plugins. JavaScript UI Library, Ajax Components & HTML5 Framework - DHTMLX. Unbeatable JavaScript Tools - The Dojo Toolkit. Open source HTML5 Charts for your website. HTML5 Charts and Gauges for jQuery and ASP.NET. Elycharts. JavaScript Charts and Maps. CanvasXpress. Arbor.js » atlas. gRaphaël—Charting JavaScript Library. D3.js - Data-Driven Documents.
NVD3. Progressive <svg> pie charts. Getting Started With Charts - Image Charts (Deprecated) This page describes the basics of using the Chart API to make charts.
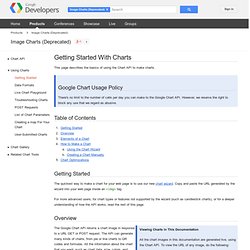
Google Chart Usage Policy There's no limit to the number of calls per day you can make to the Google Chart API. However, we reserve the right to block any use that we regard as abusive. Table of Contents Getting Started The quickest way to make a chart for your web page is to use our new chart wizard. For more advanced users, for chart types or features not supported by the wizard (such as candlestick charts), or for a deeper understanding of how the API works, read the rest of this page. Overview Viewing Charts in This Documentation All the chart images in this documentation are generated live, using the Chart API.
If you are using Firefox, right-click and then select "View Image" or "Properties". To make a URL easier to read, this document often shows it on multiple lines. The Google Chart API returns a chart image in response to a URL GET or POST request. The preceding link is an example of a basic Chart API URL. Series. NodeXL: Network Overview, Discovery and Exploration for Excel - Home. About Fusion Tables - Fusion Tables Help. Bust your data out of its silo!

Get more from data with Fusion Tables. Fusion Tables is an experimental data visualization web application to gather, visualize, and share data tables. Visualize bigger table data online Filter and summarize across hundreds of thousands of rows. Then try a chart, map, network graph, or custom layout and embed or share it. Two tables are better than one! Merge two or three tables to generate a single visualization that includes both sets of data. Make a map in minutes. Choosel - Choosel: A data visualization framework for GWT.