
Alexandre Monteiro de Barros
Plant Models. Knowledge representation and reasoning. Knowledge representation and reasoning (KR) is the field of artificial intelligence (AI) devoted to representing information about the world in a form that a computer system can utilize to solve complex tasks such as diagnosing a medical condition or having a dialog in a natural language.

Knowledge representation incorporates findings from psychology about how humans solve problems and represent knowledge in order to design formalisms that will make complex systems easier to design and build. Knowledge representation and reasoning also incorporates findings from logic to automate various kinds of reasoning, such as the application of rules or the relations of sets and subsets. Examples of knowledge representation formalisms include semantic nets, Frames, Rules, and ontologies. Model to business: poseidon for uml. Teknisk IT: Model-based systems engineering with SysML.
SysML is a light weight modelling language compared to UML.
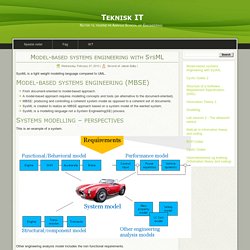
From document-oriented to model-based approach. A model-based approach requires modelling concepts and tools (an alternative to the document-oriented). MBSE: producing and controlling a coherent system model as opposed to a coherent set of documents. SysML is created to realize an MBSE approach based on a system model of the wanted system. SysML is a modelling language not a System Engineering(SE) process. This is an example of a system. Other engineering analysis model includes the non functional requirements. Laboratory for Applied Ontology - Research. MIT Technology Review.
Homepage of CityGML: Hyperlinks. Free online CAD Viewer. View AutoCAD DWG/DXF, HPGL PLT, SVG, CGM, STEP, IGES files in web. LOTAR: LOTAR 3D CAD with PMI. Goals and Objectives The 3D Mechanic Domain covers the definition of the physical shape of a component, the positioning of components within an assembly, and the information about shape, such as tolerances or surface finish, which constrains the results of a manufacturing process, but does not specify the process itself.
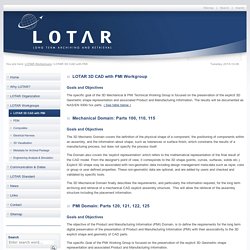
The Domain also covers the ‘explicit representation’ which refers to the mathematical representation of the final result of the CAD model. From the designer's point of view, it corresponds to the 3D shape (points, curves, surfaces, solids etc.). Explicit 3D shape may be associated with non-geometric data including design management meta-data such as layer, color or group or user defined properties. Noun Project - Icons for Everything. Argouml.tigris.org.
Surf e Saúde. Agile Development Blog. … no matter if it’s agile, Scrum, Kanban, SAFe, lean, XP or some mix of these methodologies.
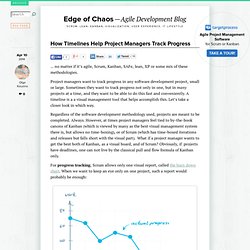
Project managers want to track progress in any software development project, small or large. Sometimes they want to track progress not only in one, but in many projects at a time, and they want to be able to do this fast and conveniently. A timeline is a a visual management tool that helps accomplish this. Let’s take a closer look in which way. Regardless of the software development methodology used, projects are meant to be completed.
For progress tracking, Scrum allows only one visual report, called the burn down chart. However, if many projects need a watchful eye of this one person, squeezing many burn down charts on one screen will not make the job any easier. Infographic Design Agency. The Internet of Things. The 83 best infographics. Every picture tells a story, as they say, but sometimes it takes a clever combination of words and pictures to tell a story quickly, concisely and in an entertaining fashion. The best infographics may look like they were simple to create in Photoshop, but designing an effective piece of data visualization is usually anything but. There are several great tools to create infographics, but these examples of infographics from around the web will show you how you can take it a step further and add a bit of style and personality to your data.
Some are older than others, but they can still provide some inspiration for those of you looking to create an infographic from scratch. Some are funny, some more serious, and all are inspiring examples of the art. If Star Wars: The Last Jedi has put you in the mood to immediately watch the original movie, hold your horses just one second. 02. 03. Are you reading this slumped at your desk? 04. Do you know your aperture from your apex? 06. 07. 09. 16. 17. The Evolution of the Web. SketchBoard - Hackster.io. Materials protocols and culture. Why the Best Designers Don’t Specialize in Any One Thing. Mustafahacalaki/Getty The digital world is at an inflection point, and the implications demand that organizations—from big companies to startups to marketing agencies—hire designers who are smart generalists.
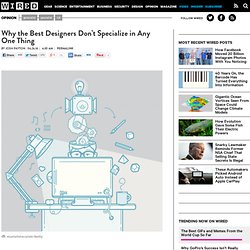
Think about the moment we’re in: mobile, big data and personalization are converging to drive truly novel user experiences across countless new channels and in real life.
11th International European Academy of Design Conference, April 22-24th 2015. ProExt - Apresentação. Core Principles - C. Roland Christensen Center for Teaching and Learning. “ All professional schools face the same difficult challenge: how to prepare students for the world of practice.
Fatores_Humanos. Casas PreFab. Projects. FAB LAB. University. Lojas Online. Blogs_Design. Graph_UML_Urban_planning. 3D assembly. FAB20_J. Digital Fabrication. Sustainability. Strategic Design. Product Design. Som e vinil.