
Fundamentals of Data Visualization. This is the website for the book “Fundamentals of Data Visualization,” published by O’Reilly Media, Inc. The website contains the complete author manuscript before final copy-editing and other quality control. If you would like to order an official hardcopy or ebook, you can do so at various resellers, including Amazon, Barnes and Noble, Google Play, or Powells.
The book is meant as a guide to making visualizations that accurately reflect the data, tell a story, and look professional. It has grown out of my experience of working with students and postdocs in my laboratory on thousands of data visualizations. Over the years, I have noticed that the same issues arise over and over. The entire book is written in R Markdown, using RStudio as my text editor and the bookdown package to turn a collection of markdown documents into a coherent whole.
This work is licensed under the Attribution-NonCommercial-NoDerivatives 4.0 International License. Perception in Visualization. Note: An extended version of this web page has been accepted for publication in IEEE Transactions on Visualization and Computer Graphics.
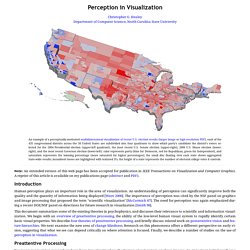
A reprint of this article is available on my publications page (abstract and PDF). Introduction Human perception plays an important role in the area of visualization. An understanding of perception can significantly improve both the quality and the quantity of information being displayed [Ware 2000]. The importance of perception was cited by the NSF panel on graphics and image processing that proposed the term "scientific visualization" [McCormick 87].
This document summarizes some of the existing theories in psychophysics, and discusses their relevance to scientific and information visualization. Preattentive Processing For many years vision researchers have been investigating how the human visual system analyses images. Feature Integration Theory Color. Pedagogy of Data Visualization Workshop. Interaction Design Foundation. Information visualization skills are in high demand thanks to the rise of “big data”.
Mashable magazine described big data analytics as “Tech’s Hottest Field.” already back in 2014. Salaries are projected between $90,000 and $180,000 a year so there’s never been a better time to develop your skills in information visualization. It’s worth noting that even if you’re not involved in big data – learning about information visualization will help your career prospects. Everyone, at some point needs to display information to other people in their business be it to persuade the executive team to fund your latest project or to explain why call center operatives are always sick the day after pay day – information visualization skills will make your life easier. This course is presented by Alan Dix, a former professor at Lancaster University in the UK and a world-renowned authority in Human Computer Interaction. A Course for Visualization in R, Taking You From Beginner to Advanced.
It’s the fourth year of running memberships on FlowingData (whoa).
With at least one tutorial per month since the beginning, I’ve worked up a pretty good collection, mostly in R. Each tutorial is self-encapsulated. Download the source and follow the steps. You don’t have to work through other tutorials for one to be useful. This is good if you already have a project in mind and want to put something together quick. However, if you’re new to R or coding in general, it can be a challenge to pick out the patterns.
Members can access the Visualization in R course today. The Course. Semaine 2 Cours 5 - Cartographie et géocodage. What is the best way for journalists to learn D3.js? Being able to find data, check it and create interactive visualizations are sought after skills in newsrooms.
Compared to just a few years ago, when you would have to pick up a book and work through examples, there are now a number of interactive trainings available online. However, the perception among journalists is still that getting into coding is “difficult”. Many journalists claim that they got into journalism because they are “not good with math”, and this thinking runs so deep in the profession that it’s very hard to overcome.
A non-coding journalist’s first steps with the command line, with handling folders of code and working with code editors are awkward. You don’t know where you are, what you do and how it all might come together. To answer these questions, we reached out to Scott Murray. Introduction to D3. Points of View. ‘Points of View’ is monthly column published by Nature Methods that deals with the fundamental aspects of visual presentation applicable to anyone who works with visual representation of data.
Each month since August 2010, my co-authors and I have focused on a particular aspect of data presentation or visualization and provide easy-to-apply tips on how to create effective presentations. This series ended with the August 2013 column but the “Points of” brand lives on; Martin Krzywinski and Erica Savig are the lead authors of “Points of Significance” on statistics. Below are links and excerpts from past columns in reverse chronological order. At the Methagora, a blog from Nature Methods, the set of 35 columns are organized into categories and was made freely available for the month of August 2013 to commemorate the completion of the series. We are working with the journal to provide the columns for free.
Nat Methods Aug. 2013 August 2013 Nat Methods July 2013 July 2013 Nat. June 2013. Visualization - CPSC 547: Information Visualization, Fall 2015-2016. CPSC 547: Information Visualization, Fall 2015-2016 Remember to reload the page, changes are frequent Instructor: Tamara MunznerFirst Class: Thu Sep 10 Time/Location: Tue/Thu 2:00-3:30, DMP 101 Office Hours: Tue 3:30-4:30 or by appointment.
X661 ICICS/CS Bldg (X Wing) UBC Cal Page: main, waitlist, both. Data-science-dataviz slides. Data Visualization - University of Illinois at Urbana-Champaign. IVMOOC: Information Visualization MOOC 2016. Data Visualization and D3.js Course. Visualization Course. This course will be offered under the auspices of the Department of Computer Science and Engineering, The Ohio State University.
CSE5544 will provide a basic introduction to the science and the underlying technology of visualization.