
Most Female and Male Occupations, Since 1950. Decades ago, men went to work and women stayed at home to take care of the home and children.

This of course changed a lot. In 1950, a bit over 30 percent of women aged 16 to 64 worked, and just over 80 percent of men in the same age group did. In 2015, it’s closer to 70 percent for women and high 70s for men. Naturally, men and women now work many of the same jobs, but many jobs are mostly men or mostly women. Here’s what it looked like in 2015, based on data from the American Community Survey. The most female job was preschool and kindergarten teachers, and the most male was carpenters. Democracy Fund Voter Study Group. Key Findings This analysis finds five unique clusters of Trump voters: American Preservationists (20%), Staunch Conservatives (31%), Anti-Elites (19%), Free Marketeers (25%), and the Disengaged (5%)There is no such thing as “one kind of Trump voter” who voted for him for one single reason.
Many voted with enthusiasm for Trump while others held their noses and voted against Hillary Clinton.Trump voters hold very different views on a wide variety of issues including immigration, race, American identity, moral traditionalism, trade, and economics.Four issues distinguish Trump voters from non-Trump voters: attitudes toward Hillary Clinton, evaluations of the economy, views about illegal immigration, and views about Muslim immigration. Introduction The surprising rise of Donald Trump in the Republican primaries and his victory in the November 2016 presidential election defied predictions of pundits and pollsters alike.
FiveThirtyEight's data journalism workflow with R. HUFFPOLLSTER: When Is It OK To Weight Polls By Past Vote? We take a closer look at the practice of weighting by past vote, as used by several pollsters.
Siena College is taking a closer look at a poll that missed by a mile in the Rochester mayor’s race. Creating Custom Web Maps. Lynchburg, Virginia: The Most Typical City in America. Introduction to Time Series Forecasting With Python - Machine Learning Mastery. Discover How to Prepare Data and Develop Models to Predict the Future Time series forecasting is different from other machine learning problems.
The key difference is the fixed sequence of observations and the constraints and additional structure this provides. In this mega Ebook written in the friendly Machine Learning Mastery style that you’re used to, finally cut through the math and specialized methods for time series forecasting. Using clear explanations, standard Python libraries and step-by-step tutorials you will discover how to load and prepare data, evaluate model skill, and implement forecasting models for time series data.
Technical Details About the Book PDF format Ebook.8 parts, 34 chapters, 367 pages.28 step-by-step tutorial lessons.3 end-to-end projects.181 Python (.py) files. Clear and Complete Examples. Convinced? Time Series Problems are Important. A Course for Visualization in R, Taking You From Beginner to Advanced. It’s the fourth year of running memberships on FlowingData (whoa).

With at least one tutorial per month since the beginning, I’ve worked up a pretty good collection, mostly in R. Each tutorial is self-encapsulated. Download the source and follow the steps. Tableau. We’re happy to announce the beta release of TabPy, a new API that enables evaluation of Python code from within a Tableau workbook.
When you use TabPy with Tableau 10.1, you can define calculated fields in Python, thereby leveraging the power of a large number of machine-learning libraries right from your visualizations. This new Python integration in Tableau enables powerful scenarios. For example, it takes only a few lines of Python code to get the sentiment scores for reviews of products sold at an online retailer.
Then you can explore the results in many ways in Tableau. You might filter to see just the negative reviews and review their content to understand the reasons behind them. Other common business scenarios include: Tableau. In writing about visualizing survey data using Tableau, I’ve found that the number one impediment to success is getting the data in the right format.
With Tableau 10 and on, it is, in fact, possible to get your survey data just so without having to invest in new tools and/or a engage in a time-consuming, error-prone procedure every time you need receive updated survey data. What do I mean by "just so"? When I deal with survey data, there are usually four different elements that need to fit together: The demographic information (e.g., age of respondents, gender, etc.)Survey responses in text formatSurvey responses in numeric formatMetadata that describes the survey data. Tableau. Advanced analytics with Python and Tableau 10.1 integration. After introducing R capabilities in Tableau 8.1, the new Tableau 10.1 now comes also with support for Python.
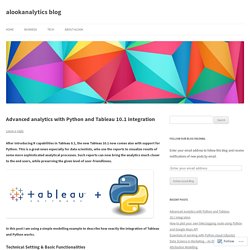
This is a great news especially for data scientists, who use the reports to visualize results of some more sophisticated analytical processes. Such reports can now bring the analytics much closer to the end users, while preserving the given level of user-friendliness. In this post I am using a simple modelling example to describe how exactly the integration of Tableau and Python works. While R integration used Rserve and you only needed to create a running Rserve session to enable a connection from Tableau, the Python integration requires you to install and set-up TabPy Server (installation instructions from the Tableau github repository can be found here). The set-up contains instructions on installing TabPy, installing Python 2.7 with Anaconda and connecting Tableau.