
Blog. Jerome Cukier. Chartsnthings. 19 Sketches of Quarterback Timelines On Sunday Eli Manning started his 150th consecutive game for the Giants, the highest active streak in the NFL and the third-longest streak in NFL history.
(One of the other two people above him is his brother, Peyton.) The graphics department published an interactive graphic that put Eli’s streak in the context of about 2,000 streaks from about 500 pro quarterbacks. The graphic lets you explore the qbs and search for any quarterback or explore a team to go down memory lane for your team. It’s not particularly important news, but the data provided by pro-football-reference is incredibly detailed and the concept lended itself to a variety of sketches.
A couple bar charts in R. And percent of games started (the people are 100% are players like Andrew Luck or RGIII who just haven’t played a lot of seasons.) Ported to a browser, just using total starts: And share of total possible starts …or all the way back to 1970. Neoformix - Discovering and Illustrating Patterns in Data. TULP inspiration. Feltron. Mapping Neighborhoods in Boston, San Francisco and New York.
Hand-drawn animation of 43 years of the Sun’s weather. (via kottke) William Stone Branching Drawings (identified by wowgreat) Geometric choropleths 1895 vs 1978. Latest. As I mentioned in my previous post, our collaboration with the Sabeti Lab is aimed at creating new visual exploration tools to help researchers, doctors, and clinicians discover patterns and associations in large health and epidemiological datasets.
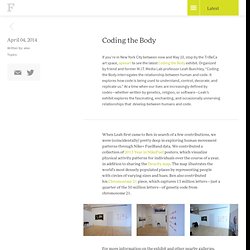
These tools will be the first step in a hypothesis-generation process, combining intuition from expert users with visualization techniques and automated algorithms, allowing users to quickly test hypothesis that are “suggested” by the data itself. Researchers and doctors have a deep familiarity with their data and often can tell immediately when a new pattern is potentially interesting or simply the result of noise. Visualization techniques will help articulate their knowledge to a wider audience. This time around I will describe a quantitative measure of statistical independence called mutual information, which is used to rank associations in the data. Blprnt.blg. Matthew Ericson – ericson.net. The winners of the 34th Edition of the Best of News Design contest were released today, so I’ve updated my interactive crosstab of SND winners that lets you see at a glance which publications won awards in which categories.
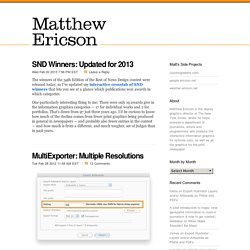
One particularly interesting thing to me: There were only 19 awards give in the information graphics categories — 17 for individual works and 2 for portfolios. That’s down from 97 just three years ago. I’d be curious to know how much of the decline comes from fewer print graphics being produced in general in newspapers — and probably also fewer entries in the contest — and how much is from a different, and much tougher, set of judges than in past years. Just pushed out an update to the Adobe Illustrator MultiExporter script that lets you specify if you want to export PNGs and JPGs at a different scale factor so that you can generate versions of the images at double resolution for iPhone retina displays. I’ve posted the slides from my presentation as a PDF. Infographics news. By Matt Stiles. Visualising Data. VizWorld.com - Visualization, Computer Graphics, and Animation. Well-formed data.
Data Visualization, Infographics, and Statistics. Junk Charts. This post is part 2 of an appreciation of the chart project by Google Newslab, advised by Alberto Cairo, on the gender and racial diversity of the newsroom.

Part 1 can be read here. In the previous discussion, I left out the following scatter bubble plot. This plot is available in two versions, one for gender and one for race. The key question being asked is whether the leadership in the newsroom is more or less diverse than the rest of the staff. The story appears to be a happy one: in many newsrooms, the leadership roughly reflects the staff in terms of gender distribution (even though both parts of the whole compare disfavorably to the gender ratio in the neighborhoods, as we saw in the previous post.) Unfortunately, there are a few execution problems with this scatter plot.
First, take a look at the vertical axis labels on the right side. I find this decision confounding. Ideas, issues, knowledge, data - visualized! Information aesthetics - Data Visualization & Information Design. Understanding by Design. Datavisualization. Chart Porn. Data Mining: Text Mining, Visualization and Social Media.