
Actelion Imagery Wizard. Actelion Imagery Wizardcorporate imagery tool Client: Actelion Pharmaceuticals Ltd Collaboration with:Interbrand Zürich Actelion is a biopharmaceutical company that researches, develops and markets medicines for diseases that still lack adequate treatments. »Create a new identity for our brand Actelion.

Don’t touch the logo, but create something the world of pharma has not seen before.« In keeping with this premise of Actelion, the brand consultancy Interbrand in Zurich conducted an initial review and discovered a generic image world with scientific motifs that lacked differentiation to the competition. Based on the idea »From medical industry to medical magic,« a new visual identity was developed that uncovers the invisible magic moment of medicine.
Top wireframing tools - Digital Nation. By Claudia Sagripanti on Jun 28, 2012 with 4 Comments I’m involved with Metro Screen’s MetroAppsLab – a mini hackathon/lab for mobile apps development.
Oliver Weidlich of Mobile Experience came in and gave a great presentation on wireframing – a how-to and why. 7 reasons to use wireframes in mobile app design To create the skeleton of the applicationTo progress sketches to higher fidelityTo formally plan out the interaction between the screens in more detail and all the functionalityInvestigate different pathsTo use more accurate relative sizingTo use OS elementsCreate assets for usability testing While the benefits of wireframing are clear, the decision on what tool to use is a bit more complicated, depending on the systems and preferences of you and your client.
In an informal poll over a strong cup of coffee with several digital agencies, Balsamiq is commonly used, but there are a number of others. Popular cross platform wireframing tools: Share your images. Play and pause your media with a gesture. JPEGmini - Your Photos on a Diet! DMesh, Triangulation Image Generator. Social Network Analysis. After learning the basics of R, I decided to learn something harder last week.
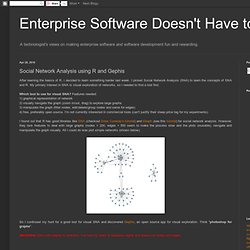
I picked Social Network Analysis (SNA) to learn the concepts of SNA and R. My primary interest in SNA is visual exploration of networks, so I needed to find a tool first. Which tool to use for visual SNA? Features needed: 1) graphical representation of network 2) visually navigate the graph (zoom in/out, drag) to explore large graphs 3) manipulate the graph (filter nodes, edit/delete/group nodes and same for edges) 4) free, preferably open source. I found out that R has good libraries like SNA (checkout Drew Conway's tutorial) and iGraph (see this tutorial) for social network analysis.
So I continued my hunt for a good tool for visual SNA and discovered Gephis, an open source app for visual exploration. WARNING: SNA with Gephis is addictive. After you download Gephi, checkout Gephi quick start guide to get your bearings. Gephi Features Tour from gephi on Vimeo. Web rendition of these graphs is also possible. Agile Creativity. GraphMonitor - Monitoramento e Mensuração no Facebook. This is now! Infographics & visuals - Web Empires. The Internet map. The map of the Internet Like any other map, The Internet map is a scheme displaying objects’ relative position; but unlike real maps (e.g. the map of the Earth) or virtual maps (e.g. the map of Mordor), the objects shown on it are not aligned on a surface.
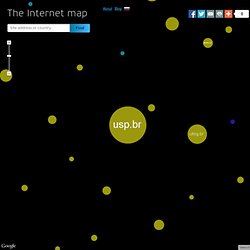
Mathematically speaking, The Internet map is a bi-dimensional presentation of links between websites on the Internet. Every site is a circle on the map, and its size is determined by website traffic, the larger the amount of traffic, the bigger the circle. Users’ switching between websites forms links, and the stronger the link, the closer the websites tend to arrange themselves to each other. Charges and springs To draw an analogy from classical physics, one may say that websites are electrically charged bodies, while links between them are springs.
Also, an analogy can be drawn from quantum physics. Anyway, the real algorithm of plotting The Internet map is quite far from the analogies given above. Semantic web. Gravatar - Globally Recognized Avatars. Datavisualization.ch Selected Tools. Spokeo People Search. Gallery · mbostock/d3 Wiki. Wiki ▸ Gallery Welcome to the D3 gallery!

More examples are available for forking on Observable; see D3’s profile and the visualization collection. Please share your work on Observable, or tweet us a link! Visual Index Basic Charts Techniques, Interaction & Animation Maps Statistics Examples Collections The New York Times visualizations Jerome Cukier Jason Davies Jim Vallandingham Institute for Health Metrics and Evaluation Peter Cook Charts and Chart Components Bar Chart Histogram Pareto Chart Line and Area Chart Pie Chart Scatterplot and Bubble chart Parallel Coordinates, Parallel sets and Sankey Sunburst and Partition layout Force Layout Tree Misc Trees and Graphs Chord Layout (Circular Network) Maps Misc Charts Miscellaneous visualizations Charts using the reusable API Useful snippets Tools Interoperability Online Editors.