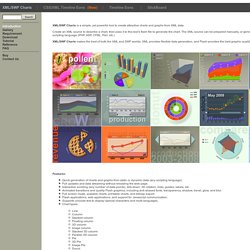

Graphing Calculator. GraphSketch. Create A Graph. Create and design your own graphs and charts online. ChartTool. Introduction. XML/SWF Charts is a simple, yet powerful tool to create attractive charts and graphs from XML data.

Create an XML source to describe a chart, then pass it to this tool's flash file to generate the chart. The XML source can be prepared manually, or generated dynamically using any scripting language (PHP, ASP, CFML, Perl, etc.) XML/SWF Charts makes the best of both the XML and SWF worlds. XML provides flexible data generation, and Flash provides the best graphic quality. Features: Quick generation of charts and graphs from static or dynamic data (any scripting language) Full updates and data streaming without reloading the web page.
Testimonials I just wanted to pass along how well your script worked for our stock performance page. Good work! This is amazing software. Just want to thank you for this wonderful upgrade. I purchased your product a couple days ago and first had time to sit down and work with it this morning. Wow, you are the best! Thanks for your great script. THIS ROCKS! Infographic App & Presentation Tool. FusionCharts - Delightful charts and gauges in JavaScript & Flash. AmCharts - JavaScript Chart Library. Chartle.net - interactive charts online!
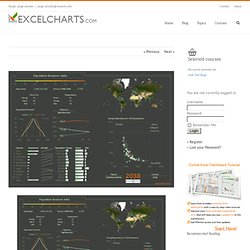
Create free online charts with online chart builder ChartGizmo.com - Use our chart software for visualizing your data. Diagram software. Online diagramming application. Excel Charts. How to Create an Excel Dashboard - The Excel Charts Blog The Excel Charts Blog. Excel dashboards and executive reports are powerful, fairly easy to design and a great way to improve your Excel and data visualization skills.

Because of its flexibility, you can virtually design any dashboard in Excel exactly the way you, or the users, imagined. And, best of all, you may want to implement it yourself or consider it a prototype and ask IT to implement it. Once you know what will the Excel dashboard be used for and what kind of metrics users expect, there are three major areas that you must address when creating it: how to bring data into your spreadsheets;how to manage the data and link it to the dashboard objects, like charts and tables;how to design the dashboard report. Let’s take a look at each of them. How to bring data into your Excel dashboard Yes, Excel is a very flexible tool, but to create an Excel dashboard you can’t just paste some data and add a few charts, can you? Usually, the data should not be entered directly into the spreadsheet. Named Ranges Macros. More Business Insights with Better Excel Charts and Dashboards The Excel Charts Blog.
Online Charts Builder. Charts Made Easy. Data Made Social. Professional graph software, scientific graphing program: Pretty Graph. Cross-Platform Data Visualization Solutions For Your Project. Chart Tools. Chart Tools. Charts Gallery - Image Charts (Deprecated) Charts Gallery - Google Chart Tools. Google Chart Creator. Python Google Chart. Code Examples - Google Chart Tools. Live Chart Playground - Image Charts (Deprecated) 10 Useful Flash Components for Graphing Data.
By Jacob Gube Flash is an excellent technology for dealing with data visualization.

It being client-side, it can reduce the amount of work your server has to perform in order to generate graphs and charts. Because of its robust ability in dealing with sleek and fluid animation and complex user interactivity, Flash is an excellent web and (and even desktop) application technology for dealing with graphing data.
In this article, you will find ten excellent Flash components that will help you in building stunningly attractive, complex, and interactive data visuals. These components will help you create an assortment of graphs and charts to aid in presenting otherwise boring and stale numerical data. 1. Open Flash Chart is an open source Flash-based graphing and charting solution developed using ActionScript 3 and compiled using Flex. Live Demonstrations: Open Flash Chart 2. XML/SWF Charts is a powerful Flash component for creating interactive graphs and charts. 3. zxChart 4. amCharts 5. 6. 7.
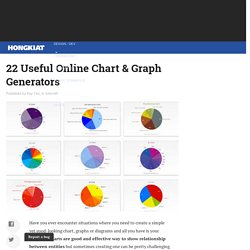
22 Useful Online Chart & Graph Generators. Have you ever encounter situations where you need to create a simple yet good-looking chart, graphs or diagrams and all you have is your browser?

Charts are good and effective way to show relationship between entities but sometimes creating one can be pretty challenging especially when your favorite word processing software is not around. In today’s post, we want to highlight some of the best web services that allow you to create various charts and graphs online on-the-fly. Most of them are easy to use and don’t you even worry about the design. Your output will be as good as what you see in the screen shots below. Full list after jump. Vitaly Friedman's Notebook: List of nifty tools for drawing diagrams, charts and flow-charts.
List of nifty tools for drawing diagrams, charts and flow-charts » Aug 18, 11:53 AM Update: The site is experiencing heavy load at the moment, please be patient.

Meanwhile, you can digg the article, if you think it could be useful for other users. Being a web-developer means not only being able to design web-sites or program their functionality. Sometimes it also means to be able to explain complex issues clearly and be able to present to your potential customers reasonable and convincing arguments – in order to find the best compromise between the customer’s wishes and the standards you respect. In fact, it is essential to make sure the customer understands which advantages you are actually offering and why this or that layout and markup are better for a given web-project. Developing web-sites over the last few years, I’ve been stumbling over the same problem over and over again: how can I visualize my idea easily and quickly? (compiled by Vitaly Friedman) Tutorials.