
Scientific Literature Images Created with Circos. GED Viz, A Data Storytelling Tool. I had the honor and pleasure to keynote an event in Berlin recently that introduced a new visualization tool to the world, GED Viz.
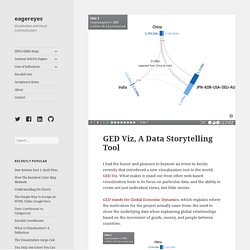
What makes it stand out from other web-based visualization tools is its focus on particular data, and the ability to create not just individual views, but little stories. GED stands for Global Economic Dynamics, which explains where the motivation for the project actually came from: the need to show the underlying data when explaining global relationships based on the movement of goods, money, and people between countries. The visualization is essentially a chord diagram, showing the countries around a circle and connecting them with bands through the center. GetBulb on Vimeo. Beta Bulb. Mudando a forma de aprender. Home · FlowingMedia/TimeFlow Wiki. Wordaizer - word cloud with a twist. Download. EDge21. Mais - Recursos educacionais multimídia. SMART Notebook Math Tools for Education. Add-on to SMART Notebook software With SMART Notebook Math Tools you receive a variety of math-specific tools, as well as access to all the great features and Gallery items available in SMART Notebook software.
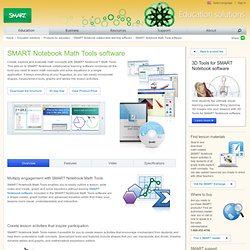
SMART Notebook Math Tools embeds all the tools you need right into SMART Notebook software, saving you from running several different applications during a lesson. Customizable math toolbar Get instant access to math-specific tools within SMART Notebook software. Customize the default toolbar to show only the tools you want, or display a second toolbar just showing math tools. Matemática Didática. Math Problem Solver. Percorrendo novos caminhos...: Mapas Conceituais e o CMap Tools.
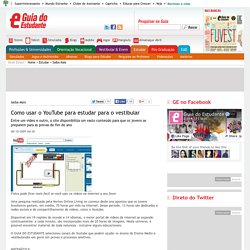
Flash My Brain - the natural software for flash card learning. Phrasal verbs flashcards. Colour Balls - Jogos. Construindo um Império - Os Astecas - History Channel - YouTube.flv. O usar o YouTube para estudar para o vestibular. Física pode ficar mais fácil se você usar os vídeos na internet a seu favor Uma pesquisa realizada pela Norton Online Living no começo deste ano apontou que os jovens brasileiros gastam, em média, 70 horas por mês na internet.
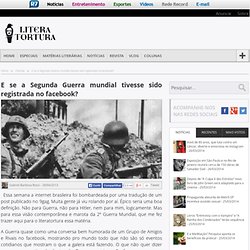
Will Tirando. E se a Segunda Guerra mundial tivesse sido registrada no facebook? Essa semana a internet brasileira foi bombardeada por uma tradução de um post publicado no 9gag.
Church Presentation Software / Easyworship / Getstarted. Glogster EDU: A complete educational solution for digital and mobile teaching and learning. Label 59 : Label . Explain . Present interactively ... in minutes. Estadaodados. Add and Sync Text Overlays of Video in PowerPoint 2010. Analise1discurso1online [licensed for non-commercial use only] / 6 Software. Considerando o grande volume de dados com que a investigação qualitativa tem de lidar e o facto das técnicas a que recorre exigir o manuseamento de grande quantidade de documentos em texto, decorrentes de anotações das observações de campo, de transcrições de entrevistas e de grupos de discussões, bem como literatura vária e páginas web, foram surgindo ferramentas informáticas para ajudar a fazer a codificação e categorização dos conteúdos.
![analise1discurso1online [licensed for non-commercial use only] / 6 Software](http://cdn.pearltrees.com/s/pic/th/licensed-commercial-software-52218331)
Da pesquisa realizada foi encontrado um diretório de ferramentas - - que reune um número considerável de programas de análise de dados, destacando-se alguns deles: Curso TopData. Download. ATEP. Make a Contour Map. 1.
Show students map images and introduce the activity.Display the images of topographic, or contour, maps. Make sure students understand that contour maps, though 2-dimensional, use contour lines to show elevation above sea level. Point out the flattest and steepest areas on the Crater Lake map. Ask students to describe how the map uses contour lines to show which terrain is steep and which is flat. Stunning charts for your Powerpoint® presentations.
NEW HORIZON ARサンプルムービー. Population Pyramids and Us. First, you can conduct a class discussion on this question: "What types of geographic questions can be answered by studying a population’s age and gender composition?
" You and your students should then assemble a list of questions and discuss exactly what types of demographic data would be useful in answering them. From there, show the class examples of population pyramids from the U.S. Census website. Sign in. Population Pyramids of the Whole World from 1950 to 2100 — PopulationPyramid.net. Using Technology in the Classroom: Tagxedo vs Wordle. Create a perfect sketch of your accident. Create Puzzle. EDU. Video scribing, Whiteboard Videos, and Animation Video production - ydraw.com. Although this will not get the best results when looking for increased traffic and conversion rates, this technique will provide a way to get an extremely cheap alternative to Ydraw’s whiteboard animation videos.
Essential tools include a dry erase board, a camera, a computer, a desk, some dry erase markers, a chair, and a light. With these tools the artist can now set up their workstation. Place the light on the table, along with the dry erase board, and rig the camera to the light so that it can be right above the dry erase board. With the camera hooked up to the computer, all one needs now is for the artist to start drawing with the dry erase markers. If the artist makes a mistake, it is easy to rewind the video filming, erase the drawing sequences and start again. To edit the whiteboard animation video, use editing software that is found on an existing computer. Free Technology for Teachers. Make Your Images Interactive - ThingLink. Interactivity Creator. Interactive Maps, Floor Plans, And Diagrams. Education Eye - Mapping Innovations.
EdTech Toolbox. Thanks for trying the Visual Thesaurus. The Visual Thesaurus is an interactive dictionary and thesaurus that allows you to discover the connections between words in a visually captivating display.
B2B Technology Infographics Visual Explanations - Frame Concepts Animation. Edudemic. Download the Computable Document Format (CDF) InfoKit. Tools. Showcase of Free Infographic PSD Templates Mostly designers and companies keep trends to be exist as all-rounder in this designing world and now hundred thousands word report split into an complete infographics image that is relationship of new design techniques, most of the time creative and professional presentation win Olympic meddle then a physically better athlete, only using my own words as reference because I recently have so many jobs for design infographics and now I would like to share to others why we should get control on infographic design techniques because modern world always adopt better way of representations.
Advanced Infographic Charts Infographic Vector Kit Infographics Template blue and black infographic vector Infographics Business Vector infographics Go Green – Infographic Elements Infographic design elements vector Infographic and charts set Elements of infographics vector Infographic Template and Charts v5 Colorful Vector Infographic Chart Buttons Labels Colorful Infographics Charts & Comparisons Vector Set. RealtimeBoard. RealtimeBoard.
Augmented Reality in Education. Part II - ARLab Blog. Among all the Augmented Reality applications, one of the most important and practical ones is its use in education. There are many companies and developers which make an effort to introduce this technology to students, professionals and researchers related to the education field. Like in nearly all the Augmented Reality applications, through specific images into the text books, students will be able to access extra 3D contents related to each image. This additional information will improve, not only the students´ experience, but also the way in which they learn the lesson, allowing them to understand the content much better than without Augmented Reality.
Create simple diagrams in a snap! Create Video Notebook: Dan Roam and The Back of the Napkin. Doing this blog is like standing in the library with thousands of books and resources. I get overwhelmed at the talent and creativity that surrounds us. I also get angry at what we choose to pay attention to but that is another story. I need to learn to tell visual non-fiction stories using video. Dan Roam and his book The Back of the Napkin is helping me learn that skill. Dan coaches business leaders to use visuals to explain concepts. Parece Facebook, mas não é: são as redes educativas - Educação. Internet. Projeto das novas ferrovias brasileiras - Valec. Preparação Estratégica, Eficiente, Racional e Planejamento de Estudos para Concursos Públicos e Exame da OAB.
Music Theory Pro! Learn how to read music. Olhar Digital : Central de Vídeos : Sites te ajudam a reforçar os estudos no final de ano.
Análise de Redes Sociais. Social Network Analysis (SNA) Software with Sentinel Visualizer. Degree Centrality Degree centrality is simply the number of direct relationships that an entity has. An entity with high degree centrality: Is generally an active player in the network. Linha do Tempo. Mapa Mental.